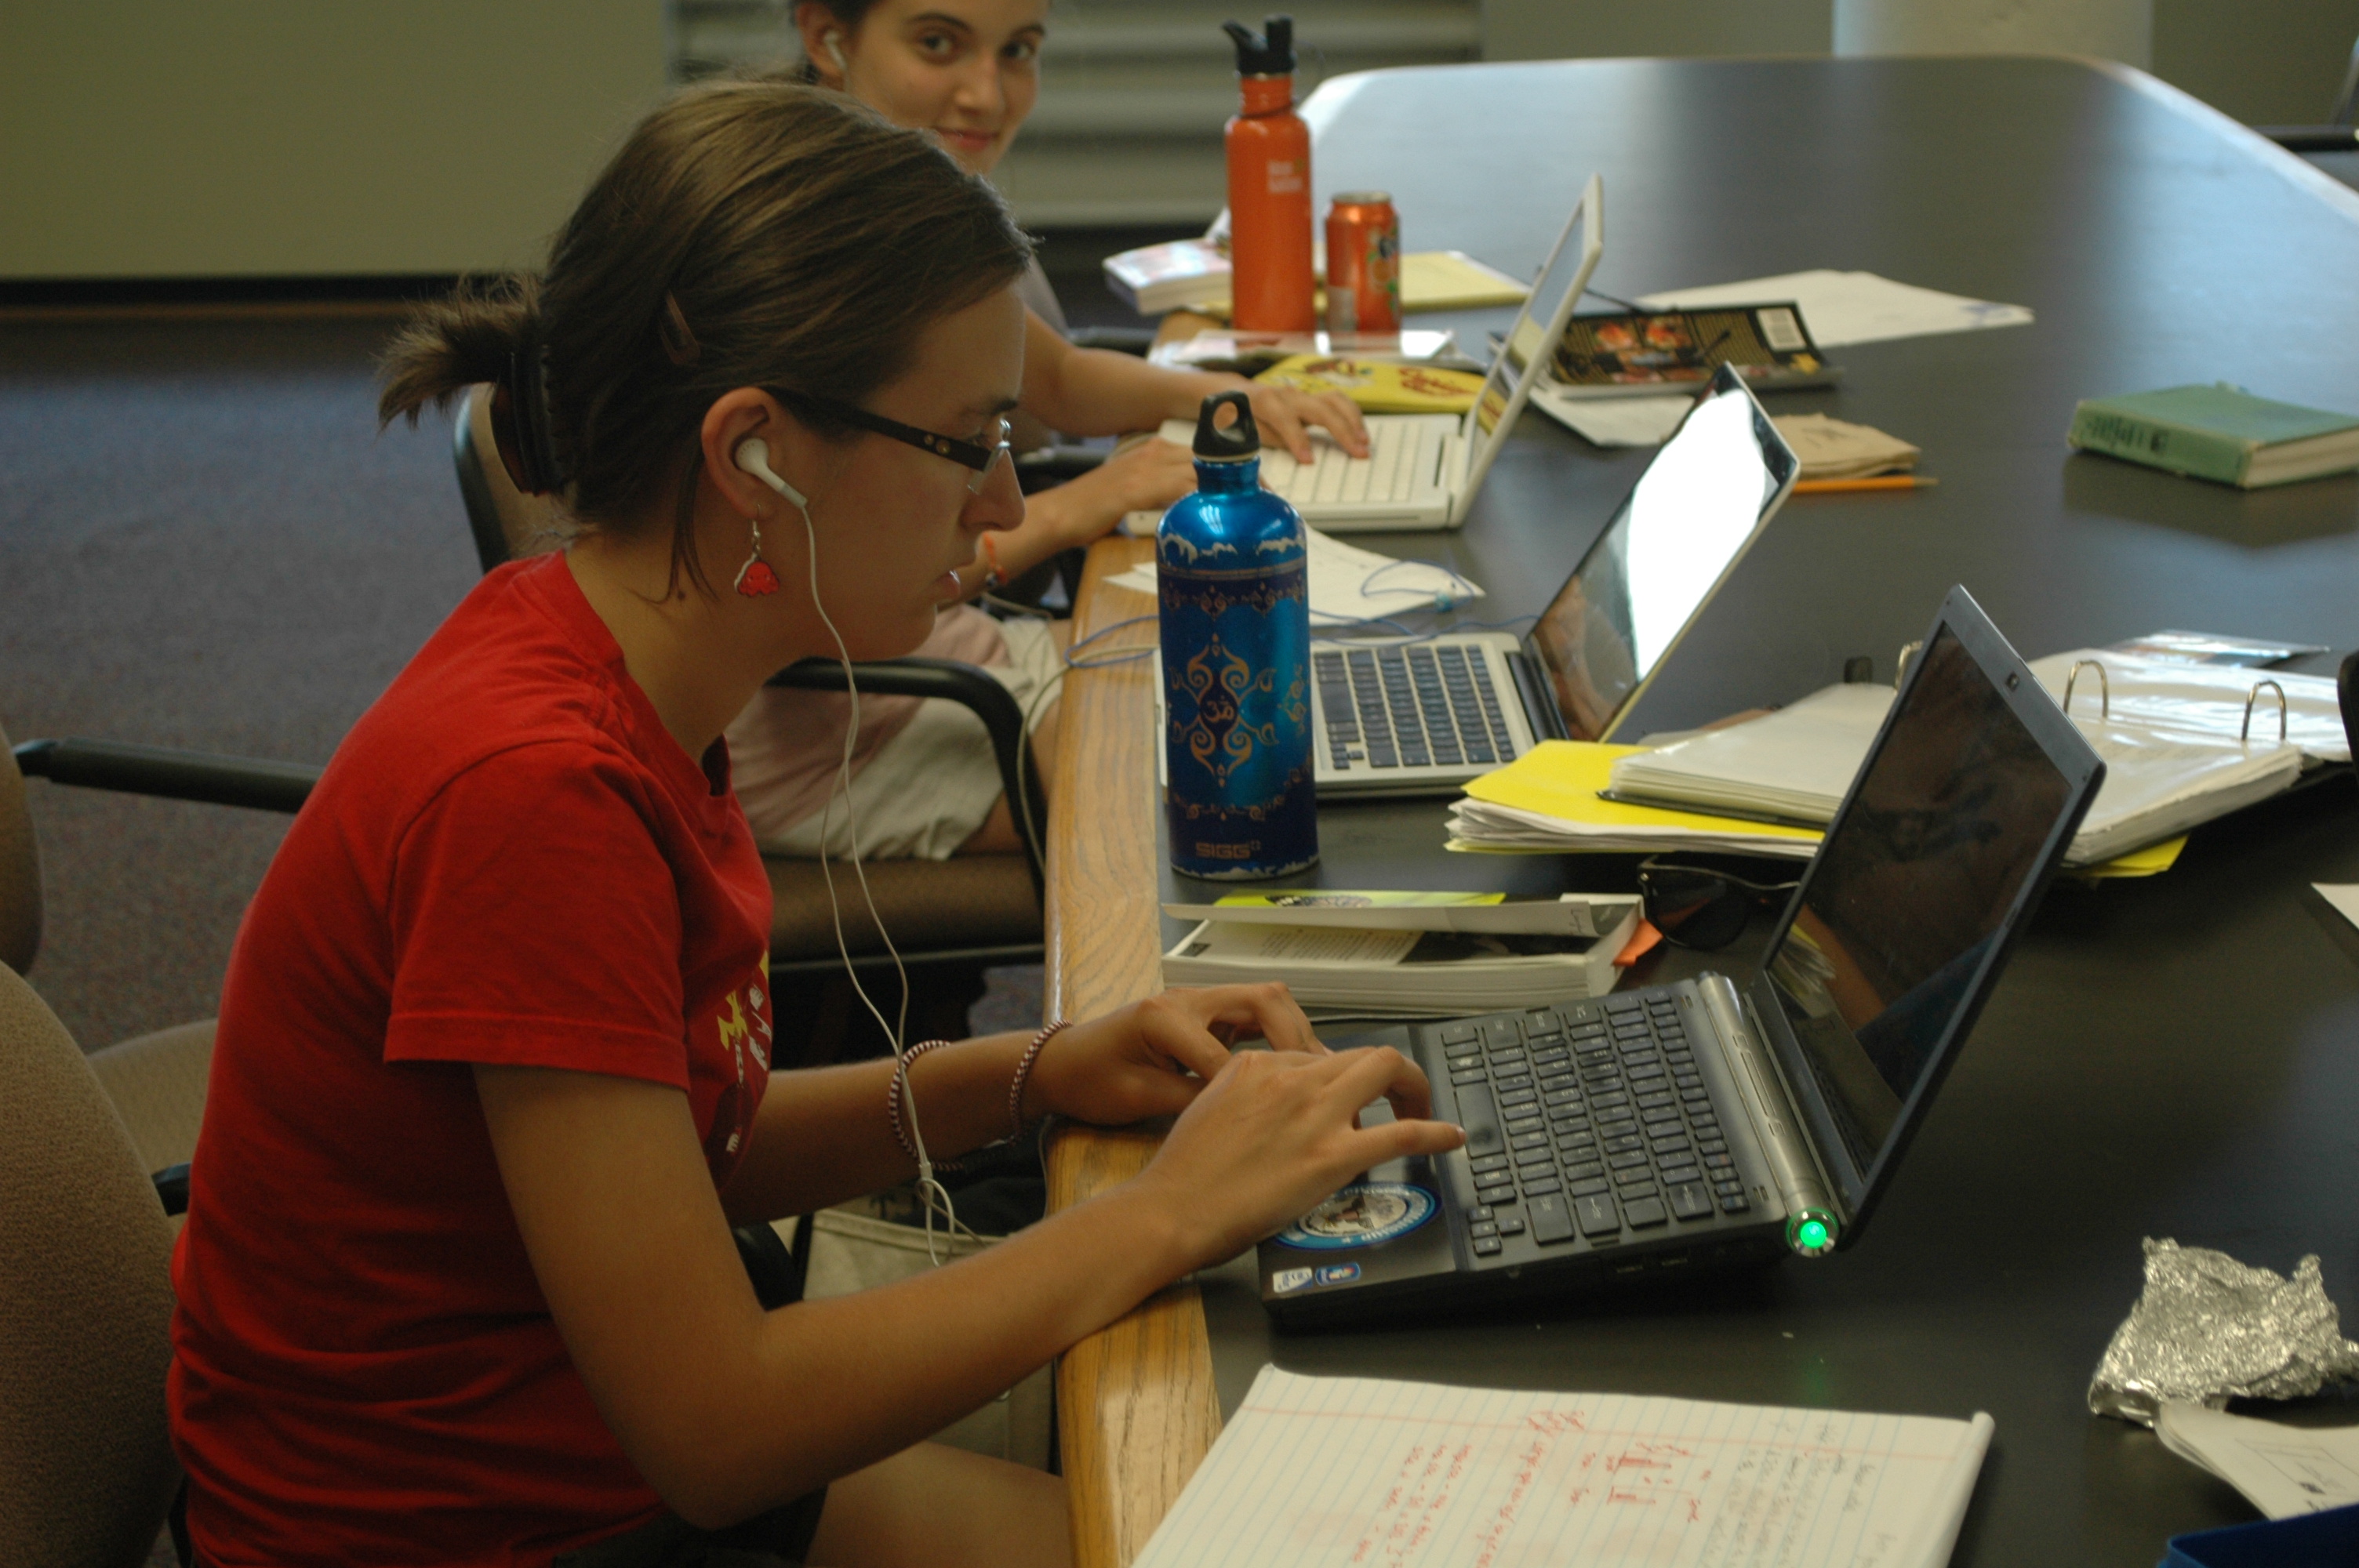
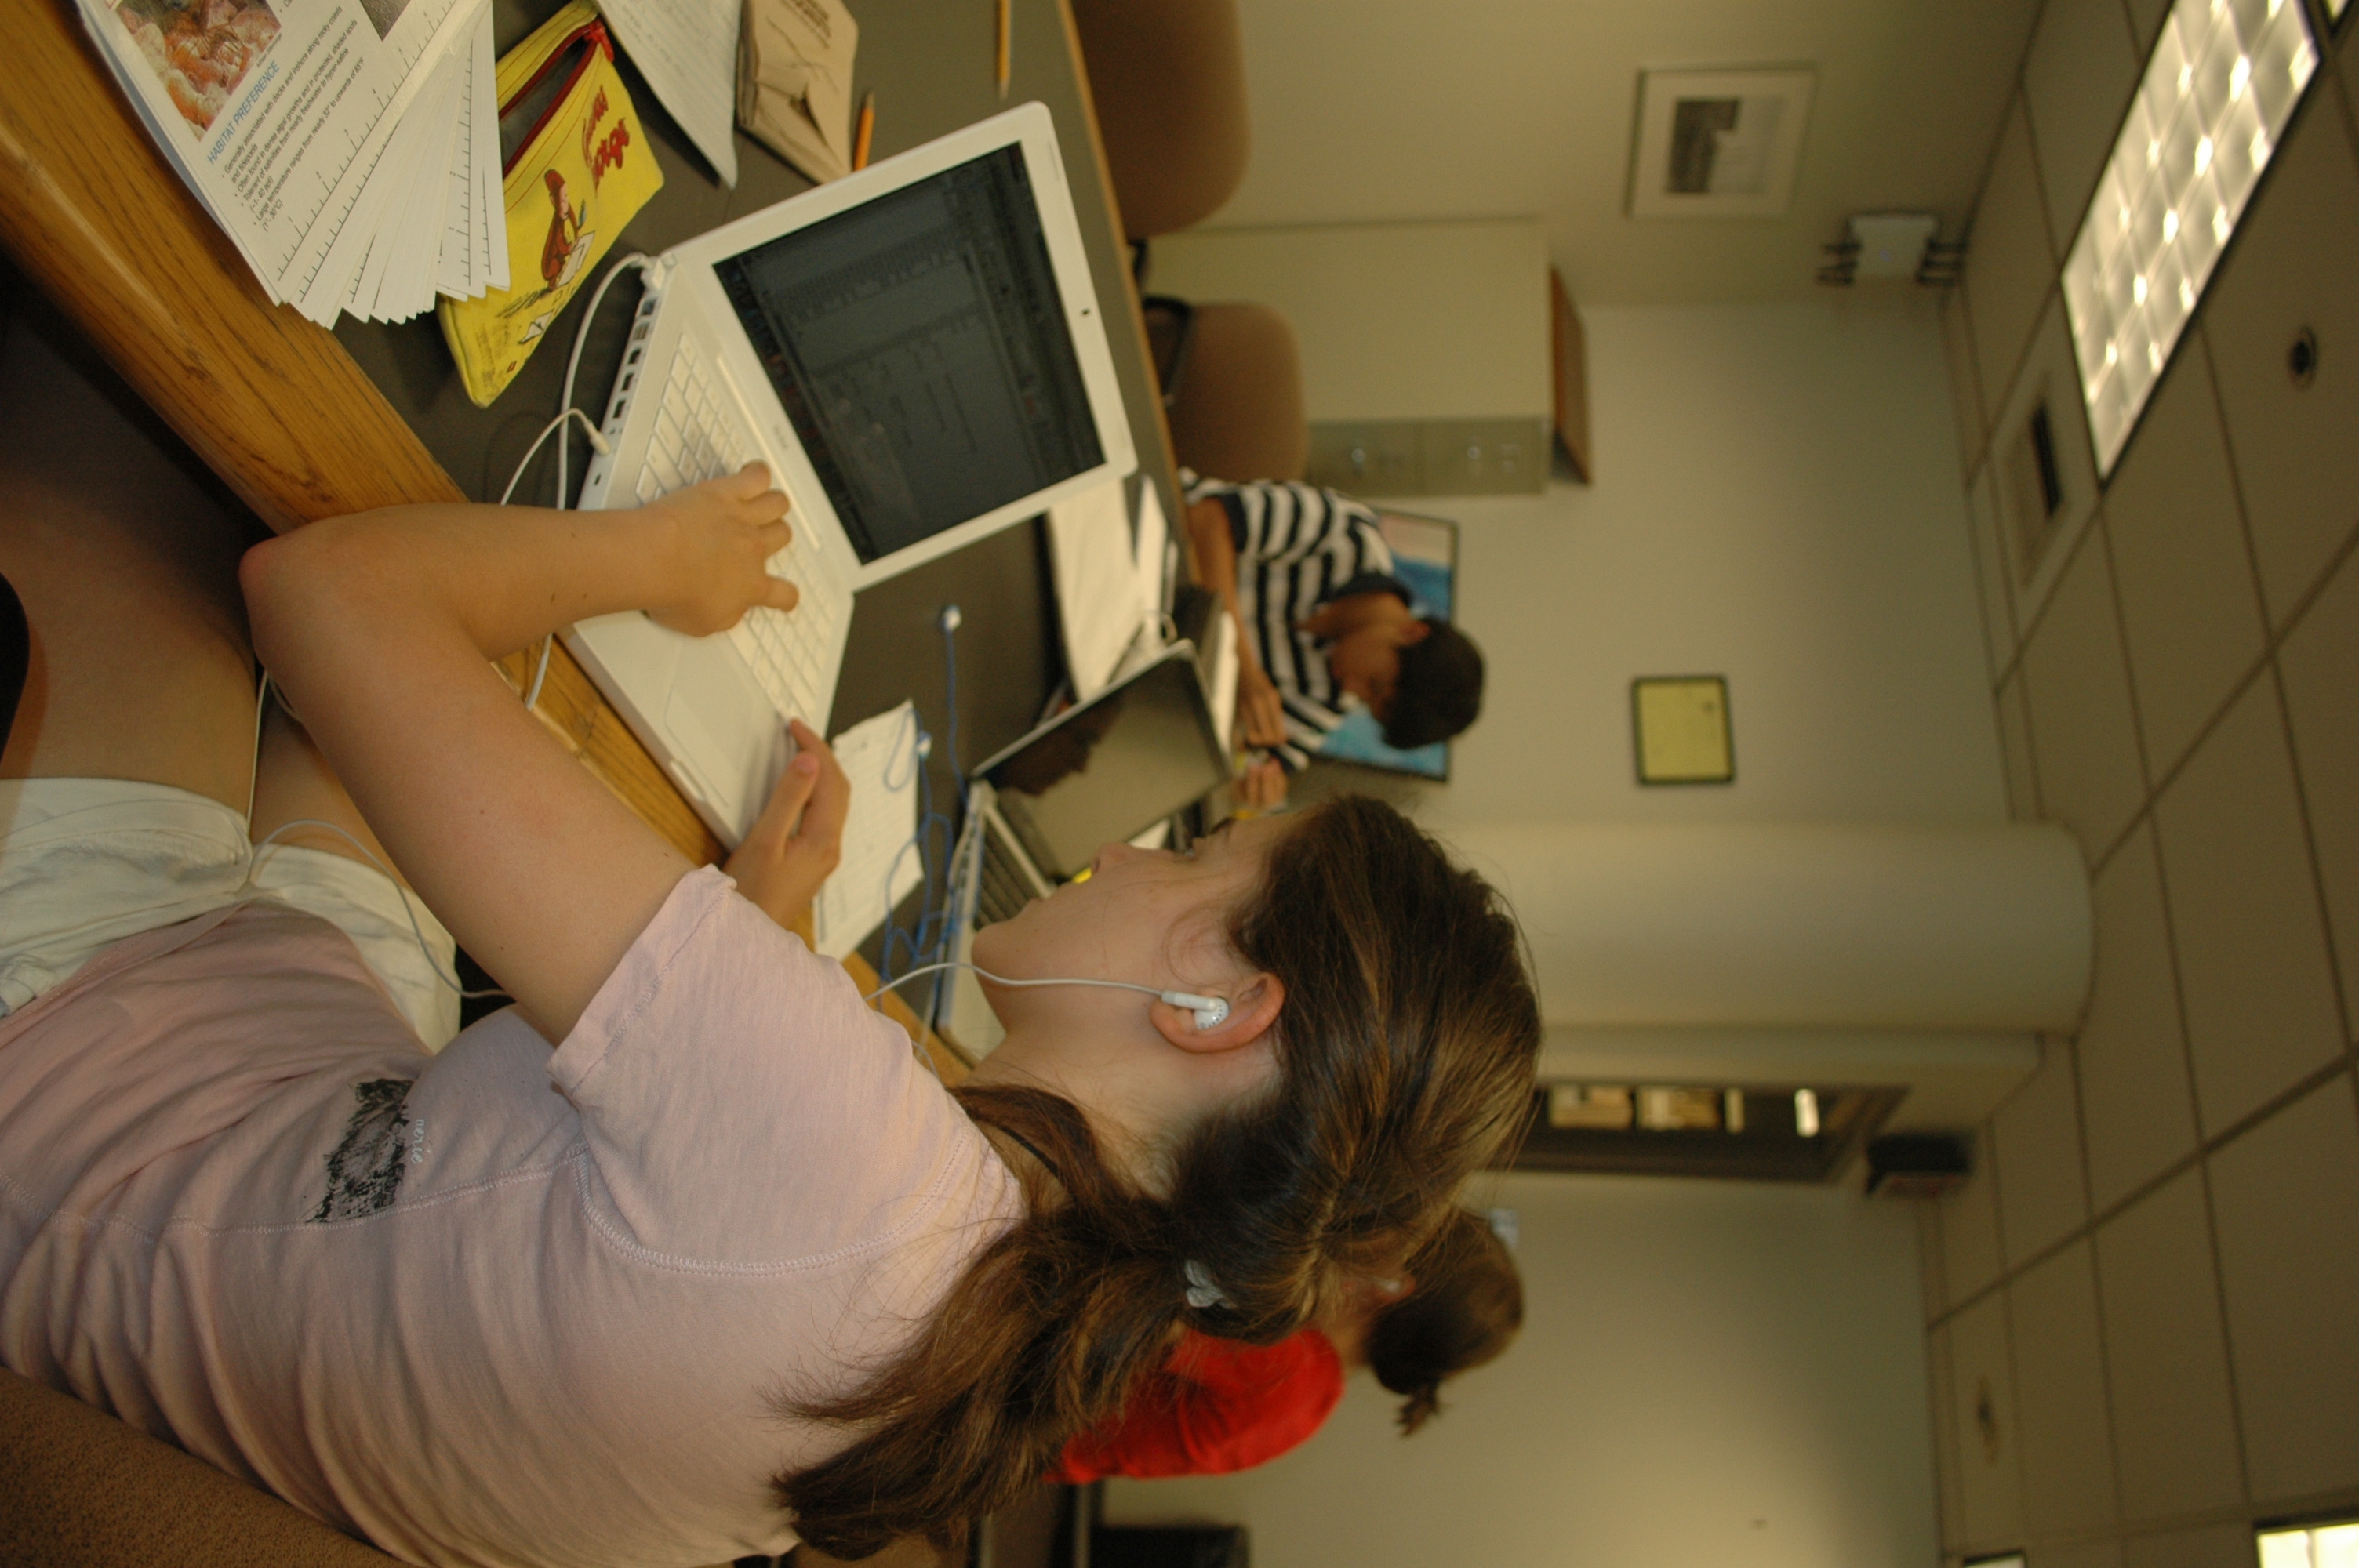
Mystery Tunicates and Shrimp Invaders

Data Entry

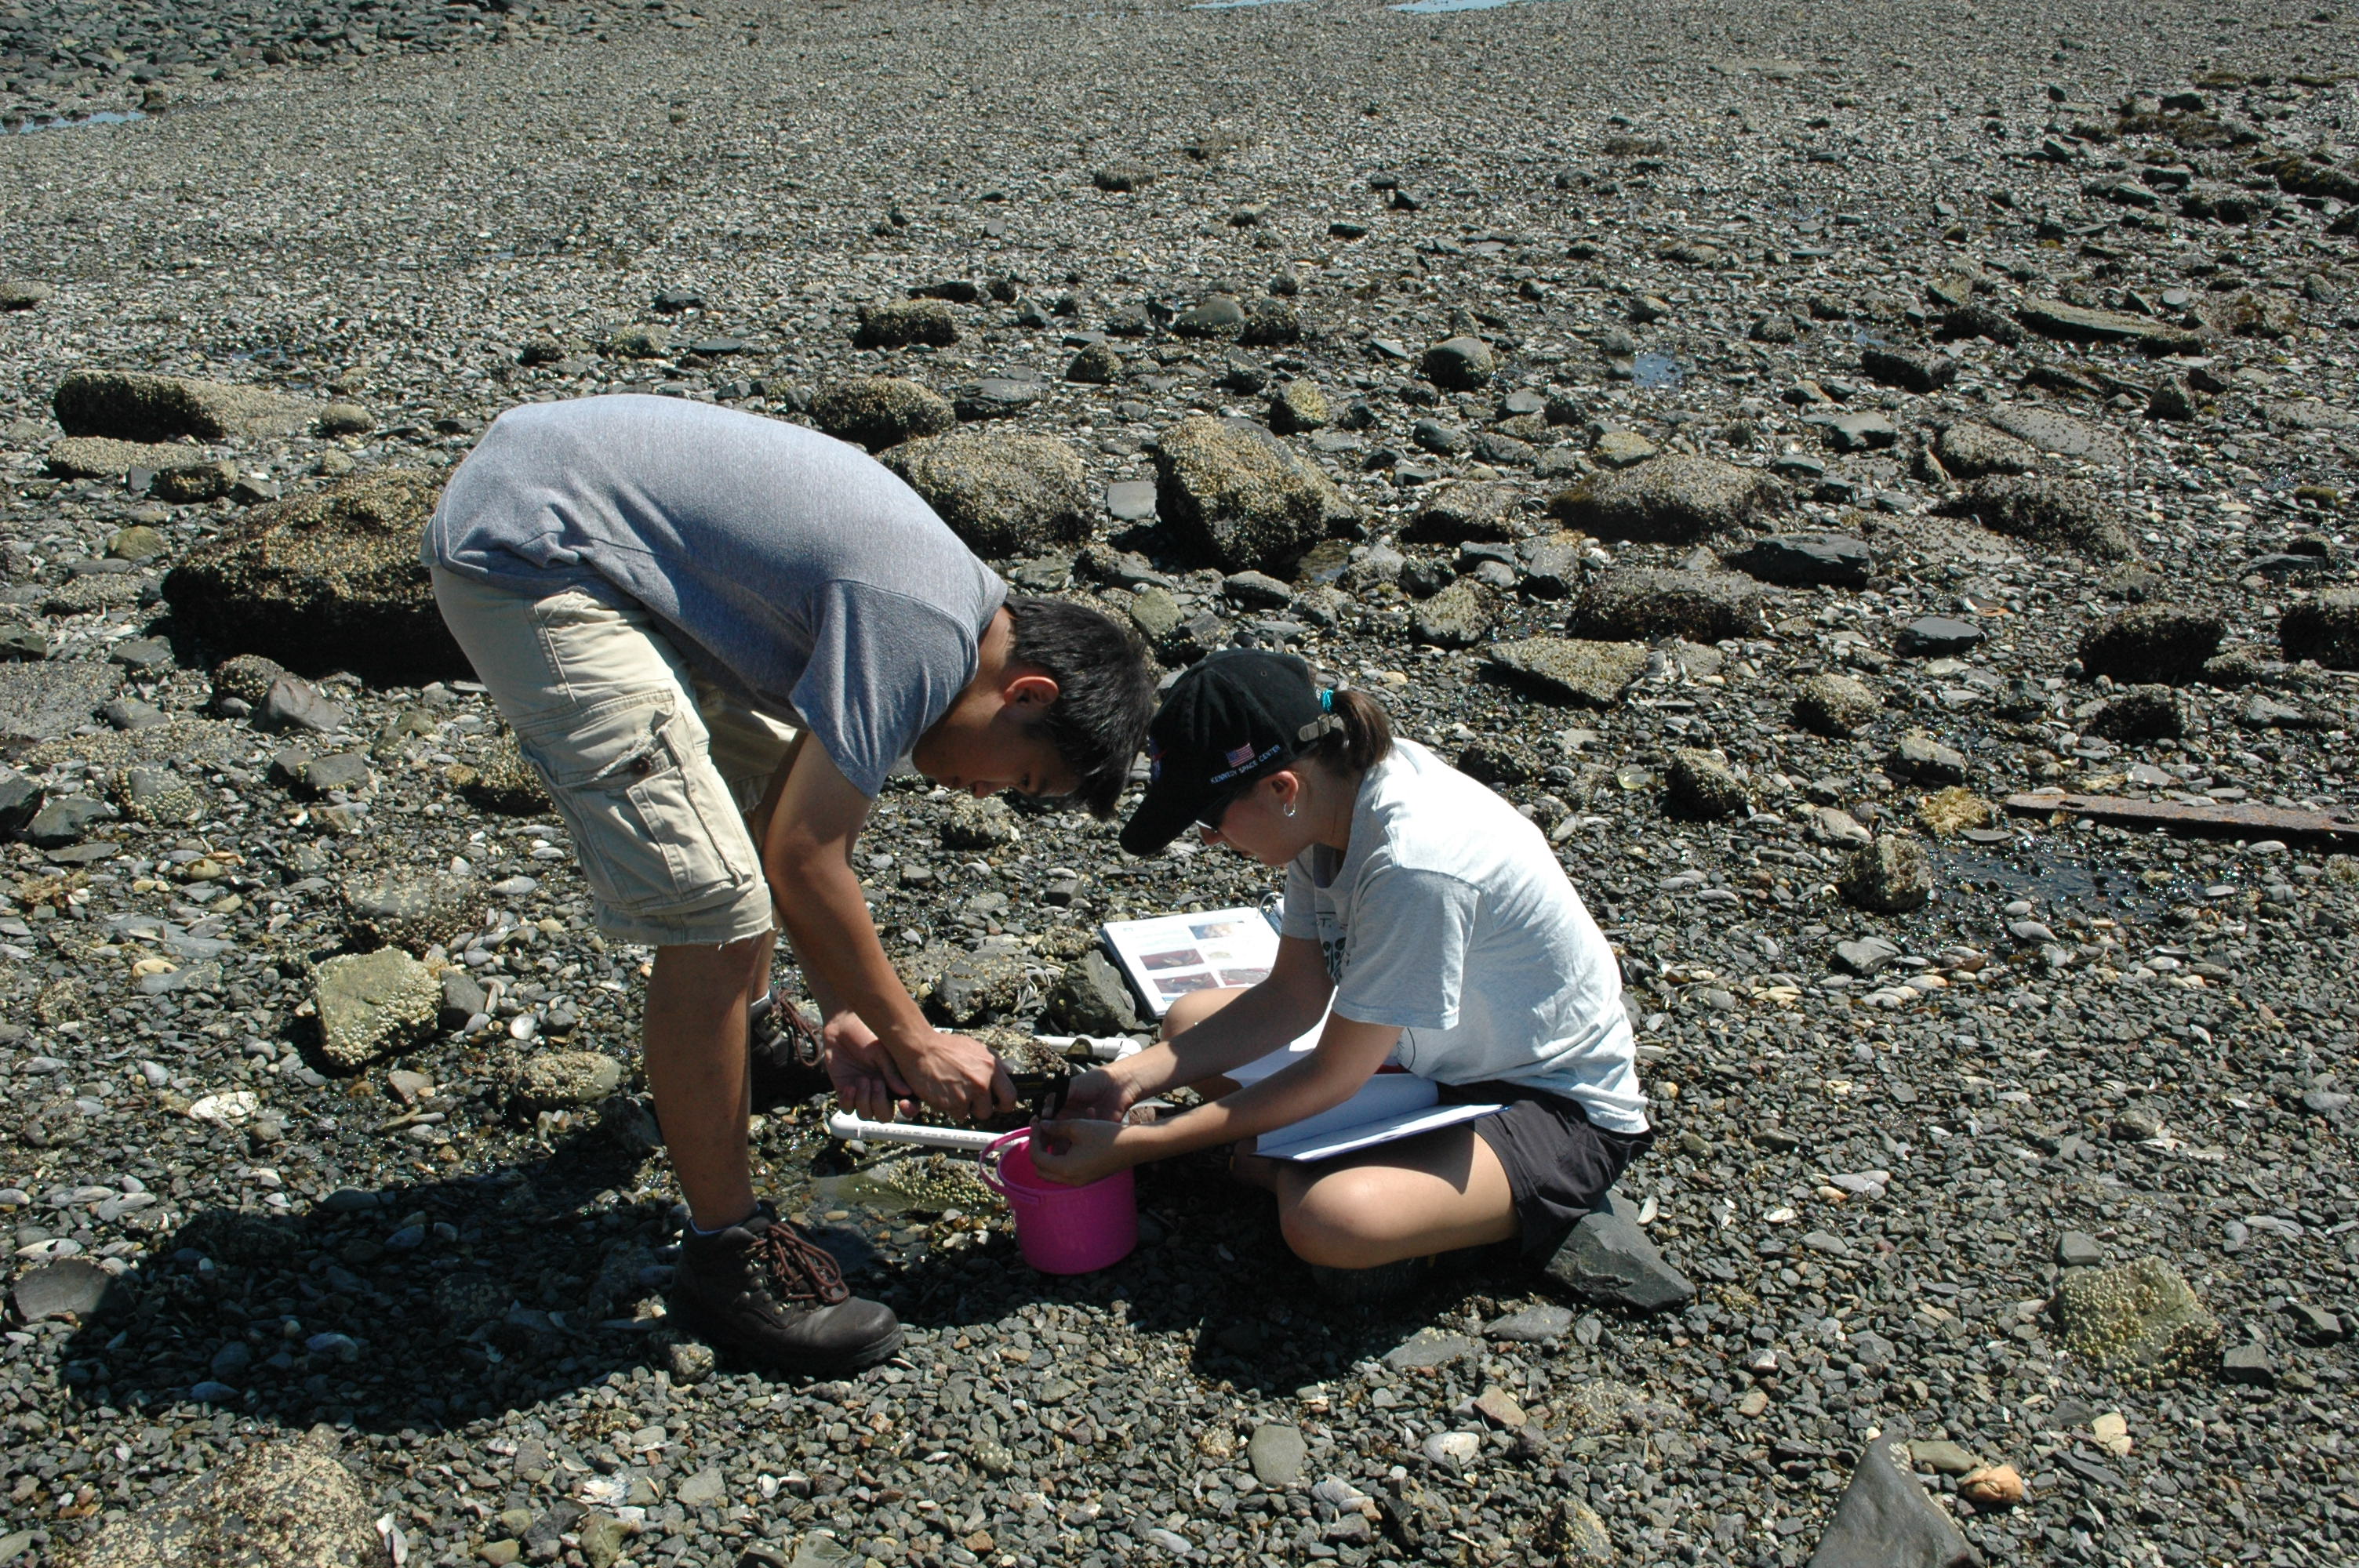
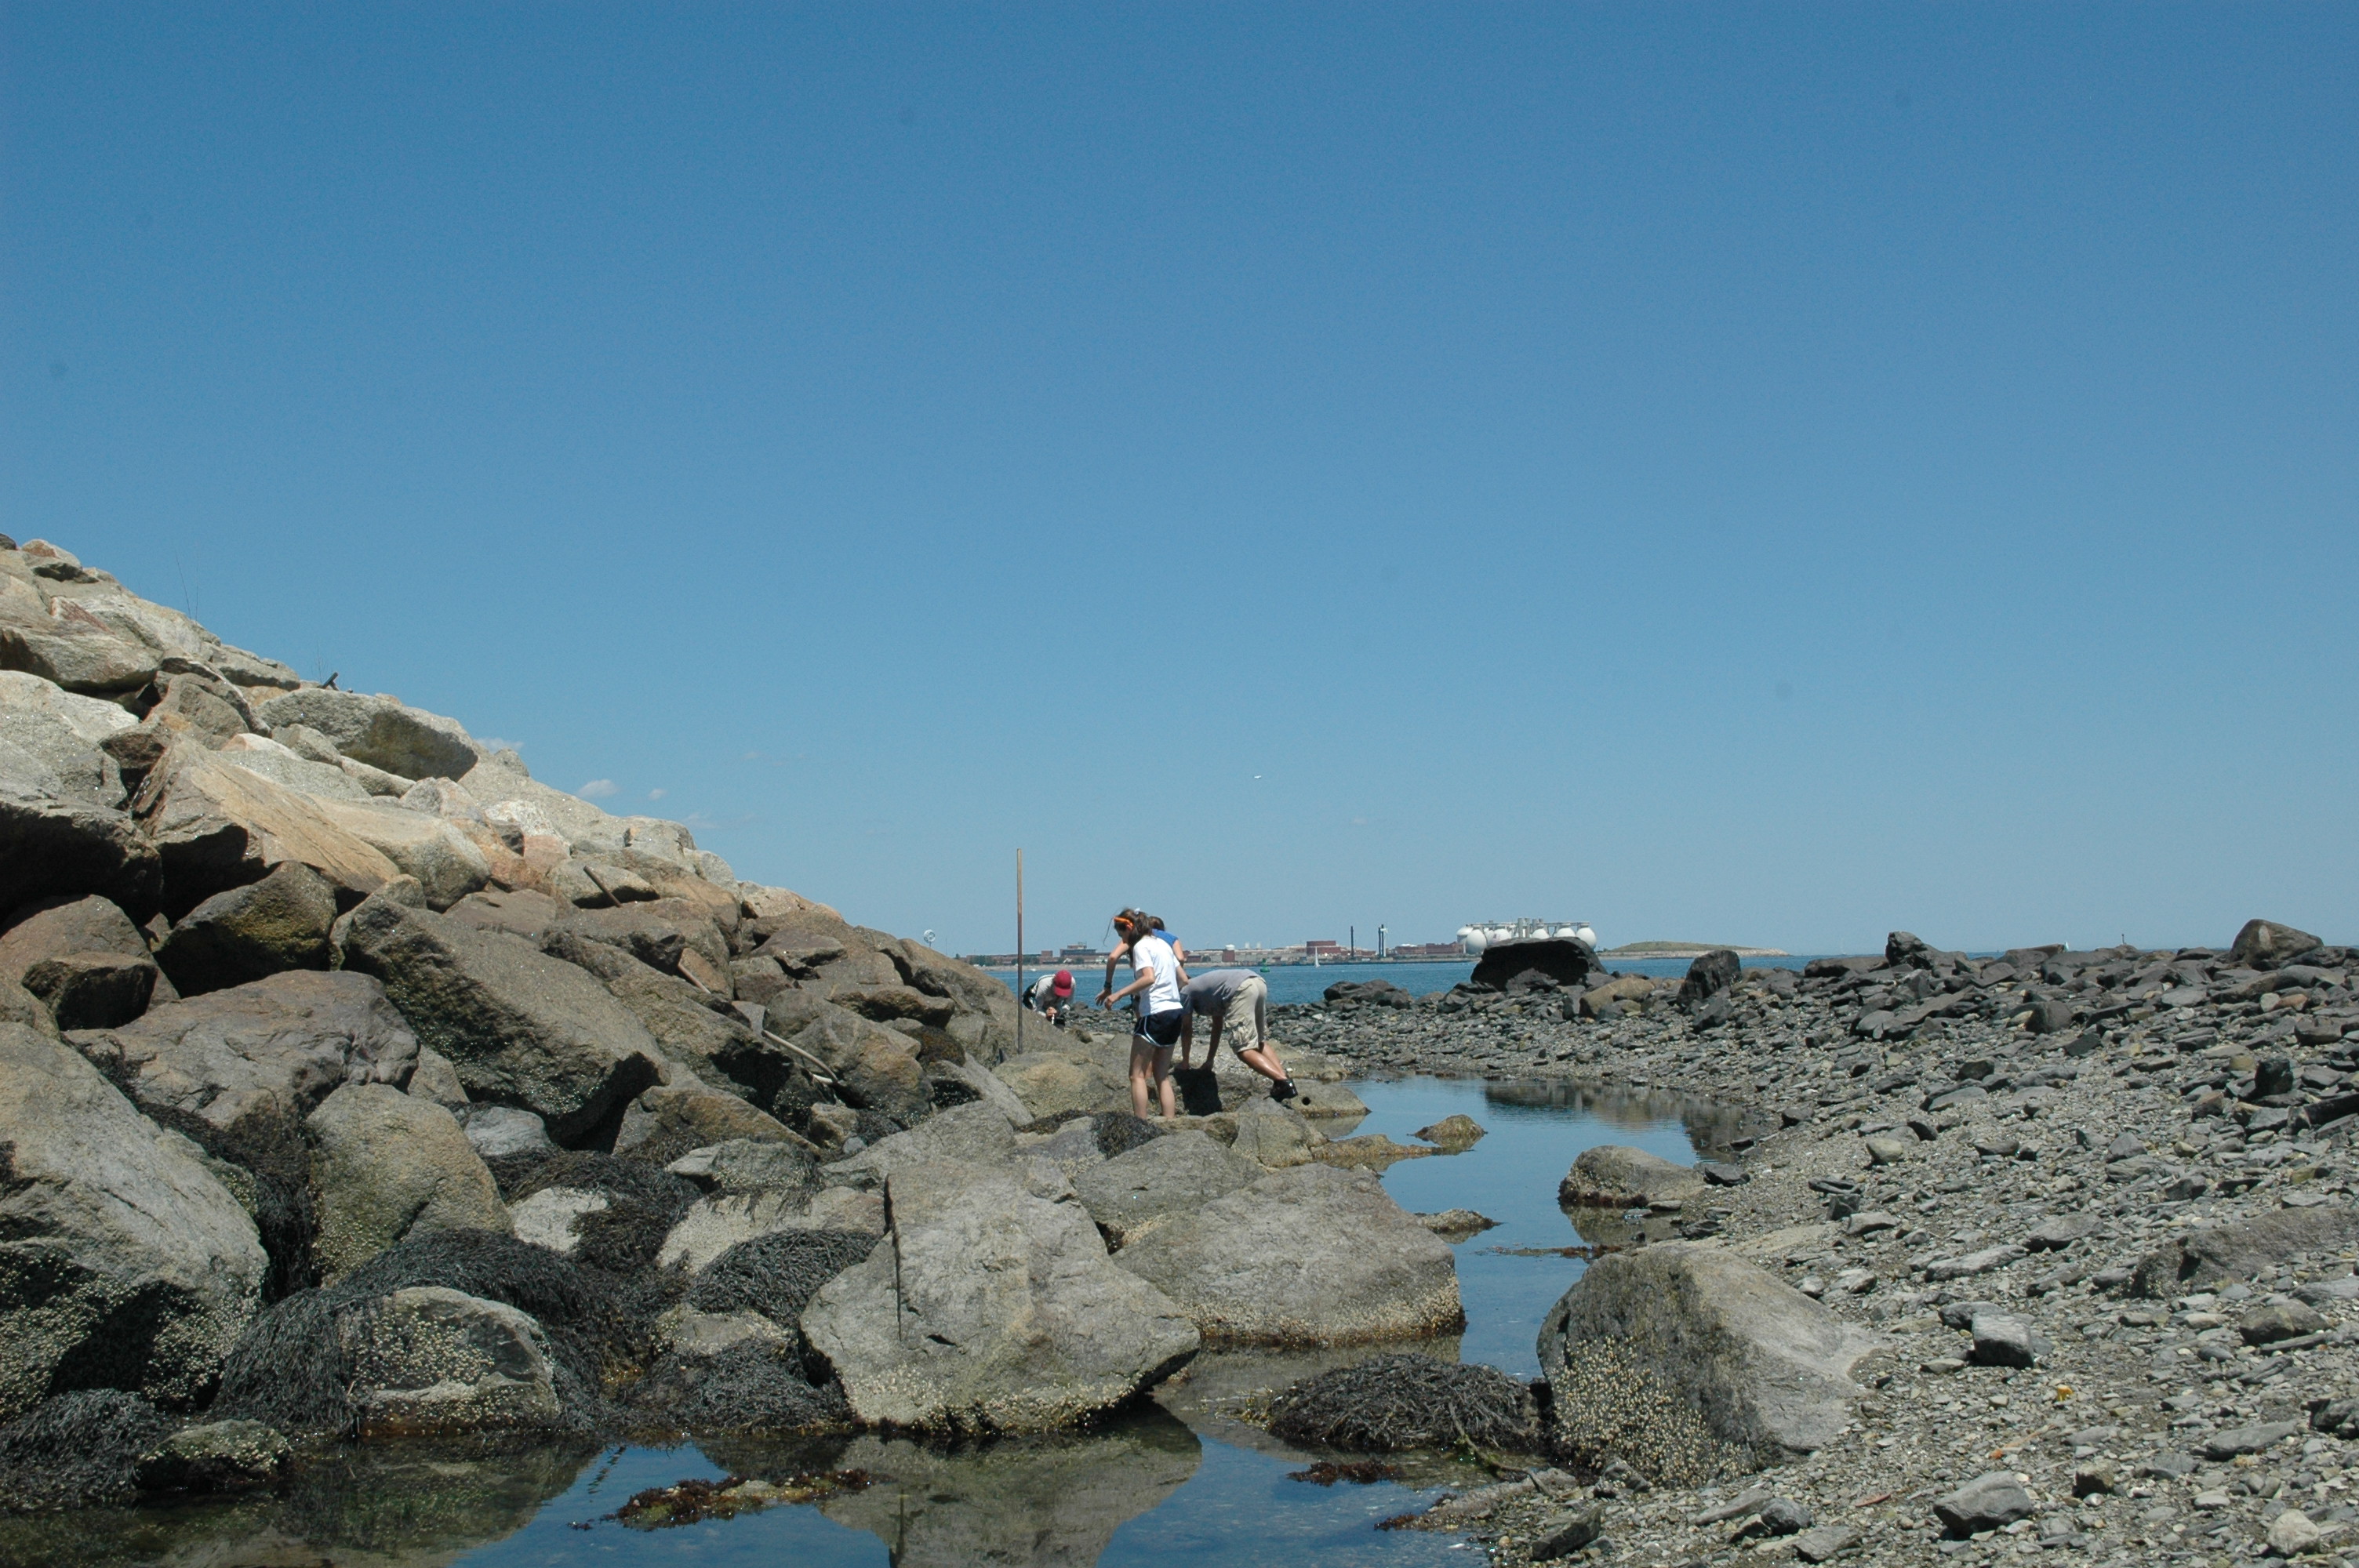
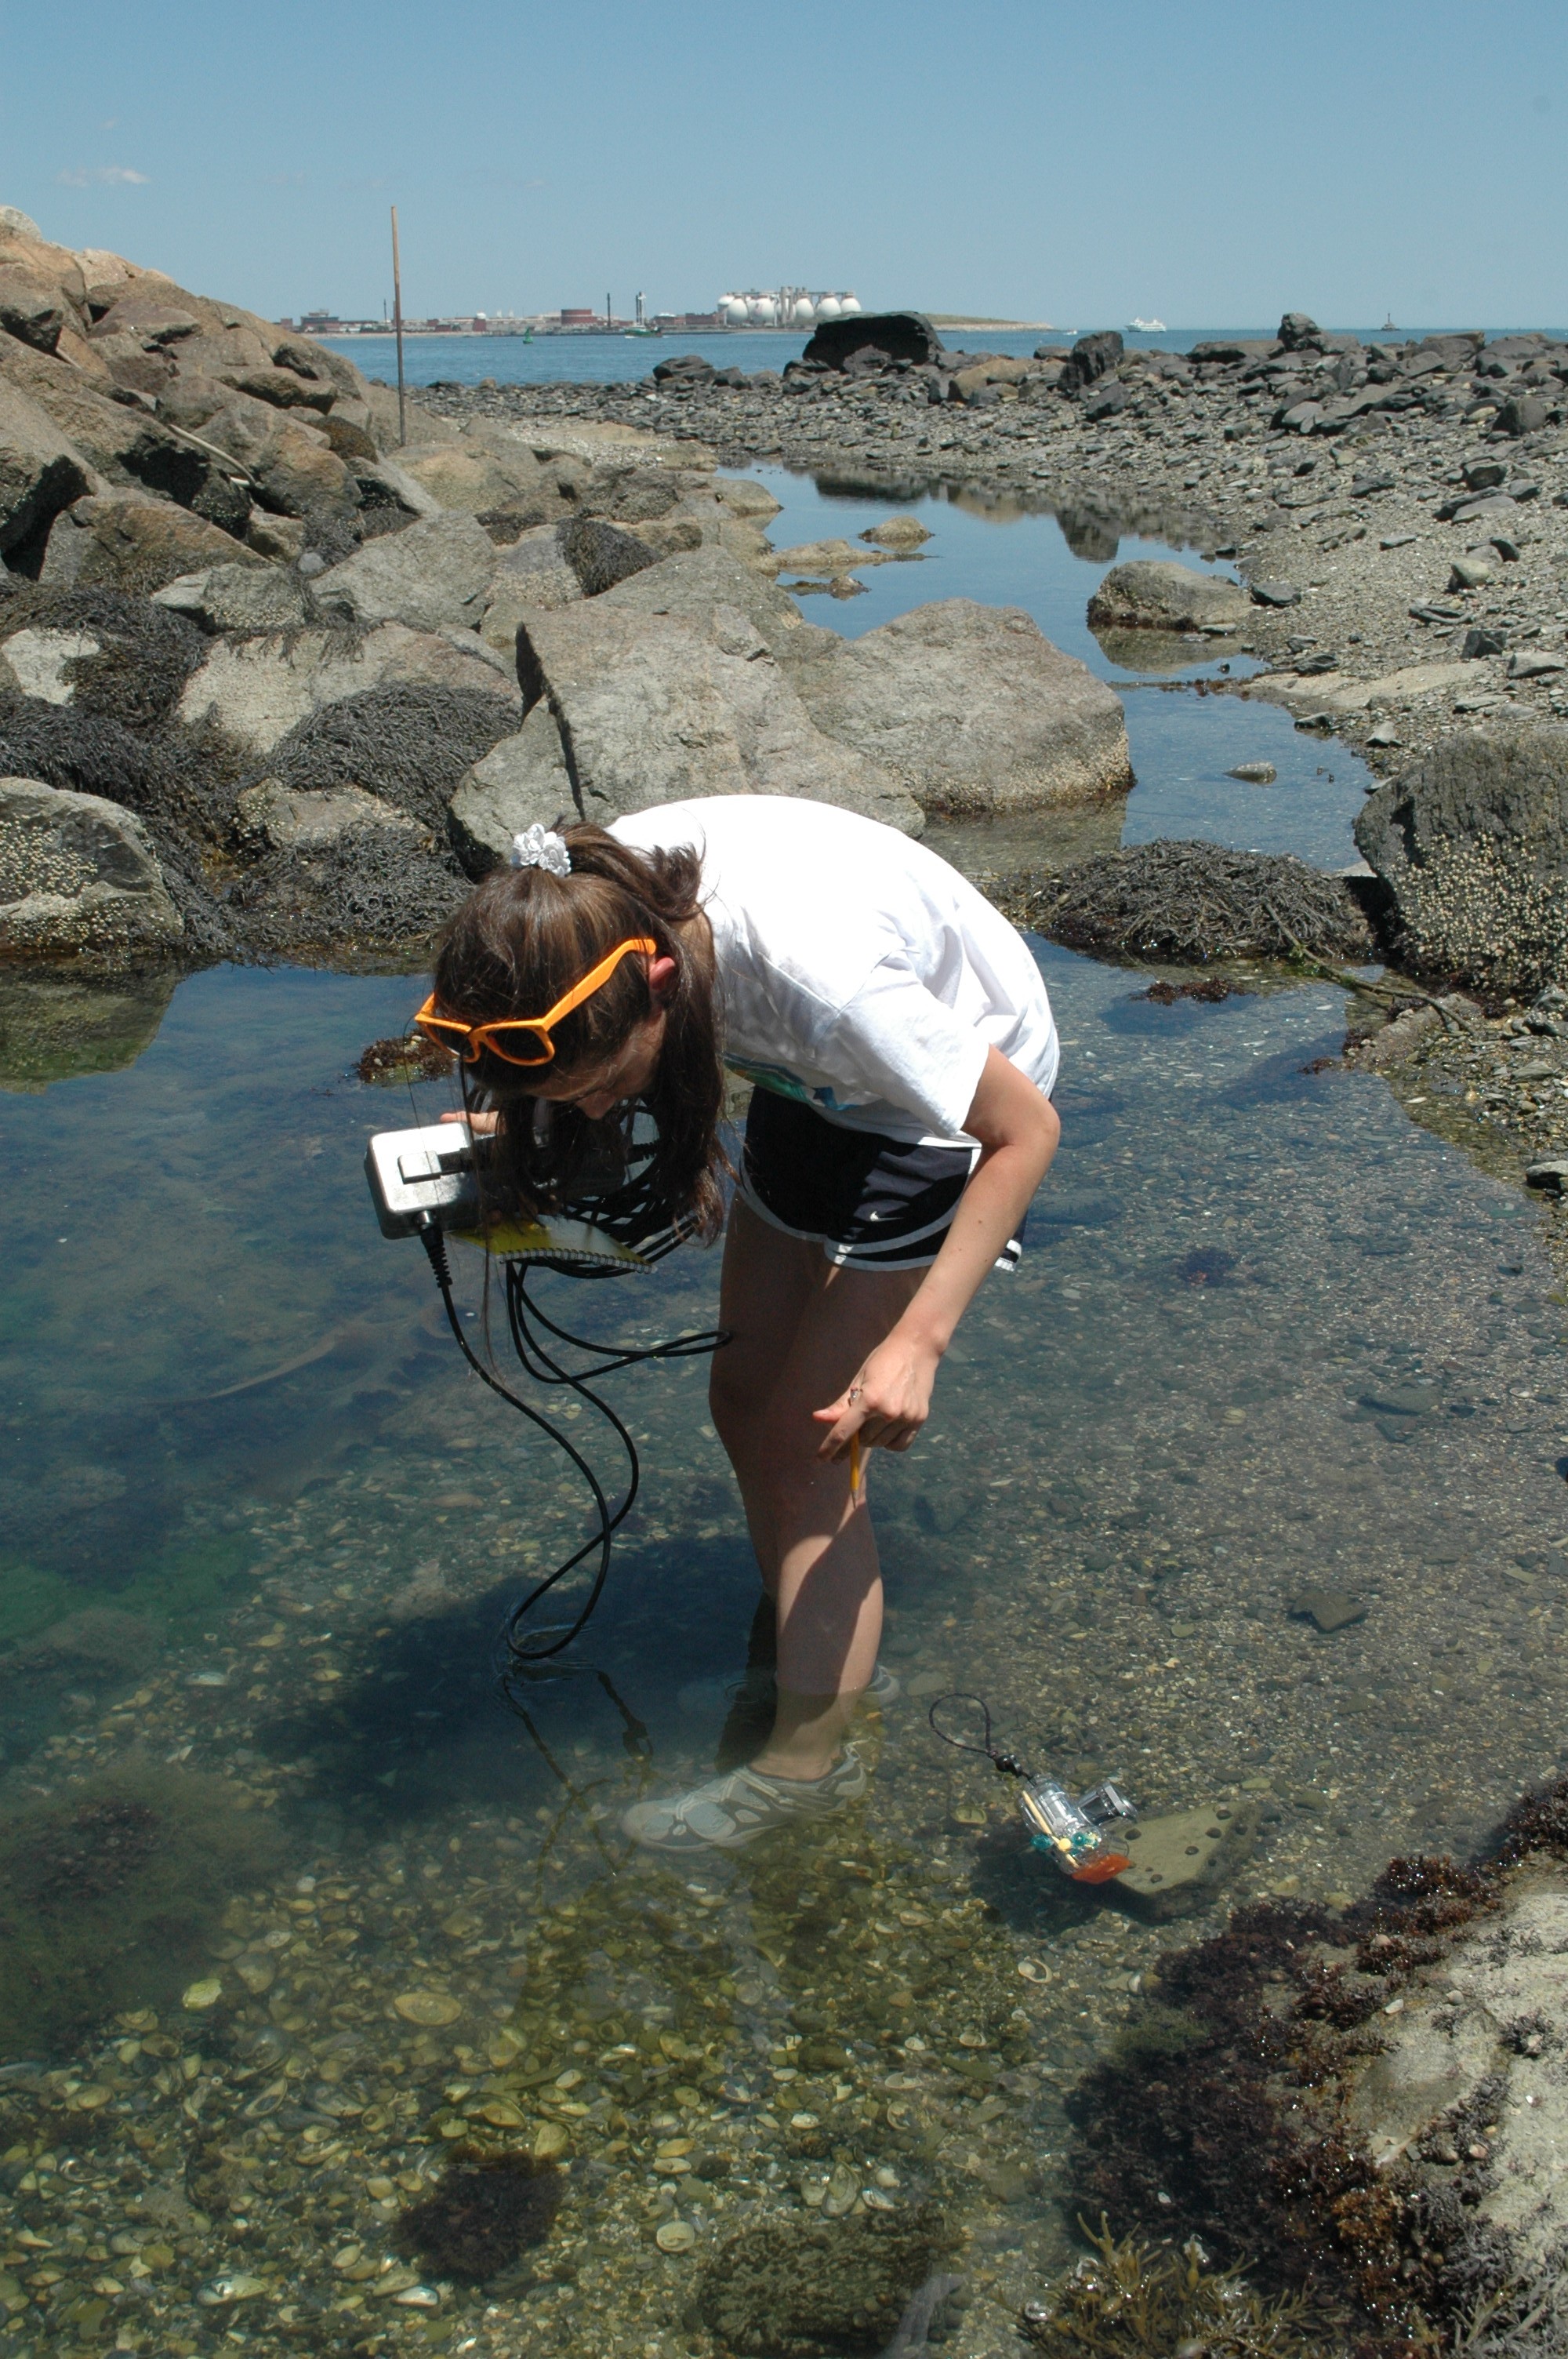
We had a very productive week on the Harbor Islands and gathered a lot of data. The focus of this week is taking the data we collected in the field and manipulating it into a form that will be useful for the National Park Service and other scientists. We compiled our data in the standardized format that the Park Service uses; Noting the transect location, quadrat number, which side of the transect it was on, and all species found in each quadrat. As we entered our data into the database we kept an eye out for any trends on which we could focus our own more individual research questions, as well as looking for overall trends on which to perform statistical analyses. We also entered our beach profile data and made graphs that show the overall slope of each of our transects. All the water quality data that we collected was analyzed and entered into our database. We performed titrations on samples collected the week before in order to study the level of biological oxygen demand vs. the original dissolved oxygen content of sample areas.

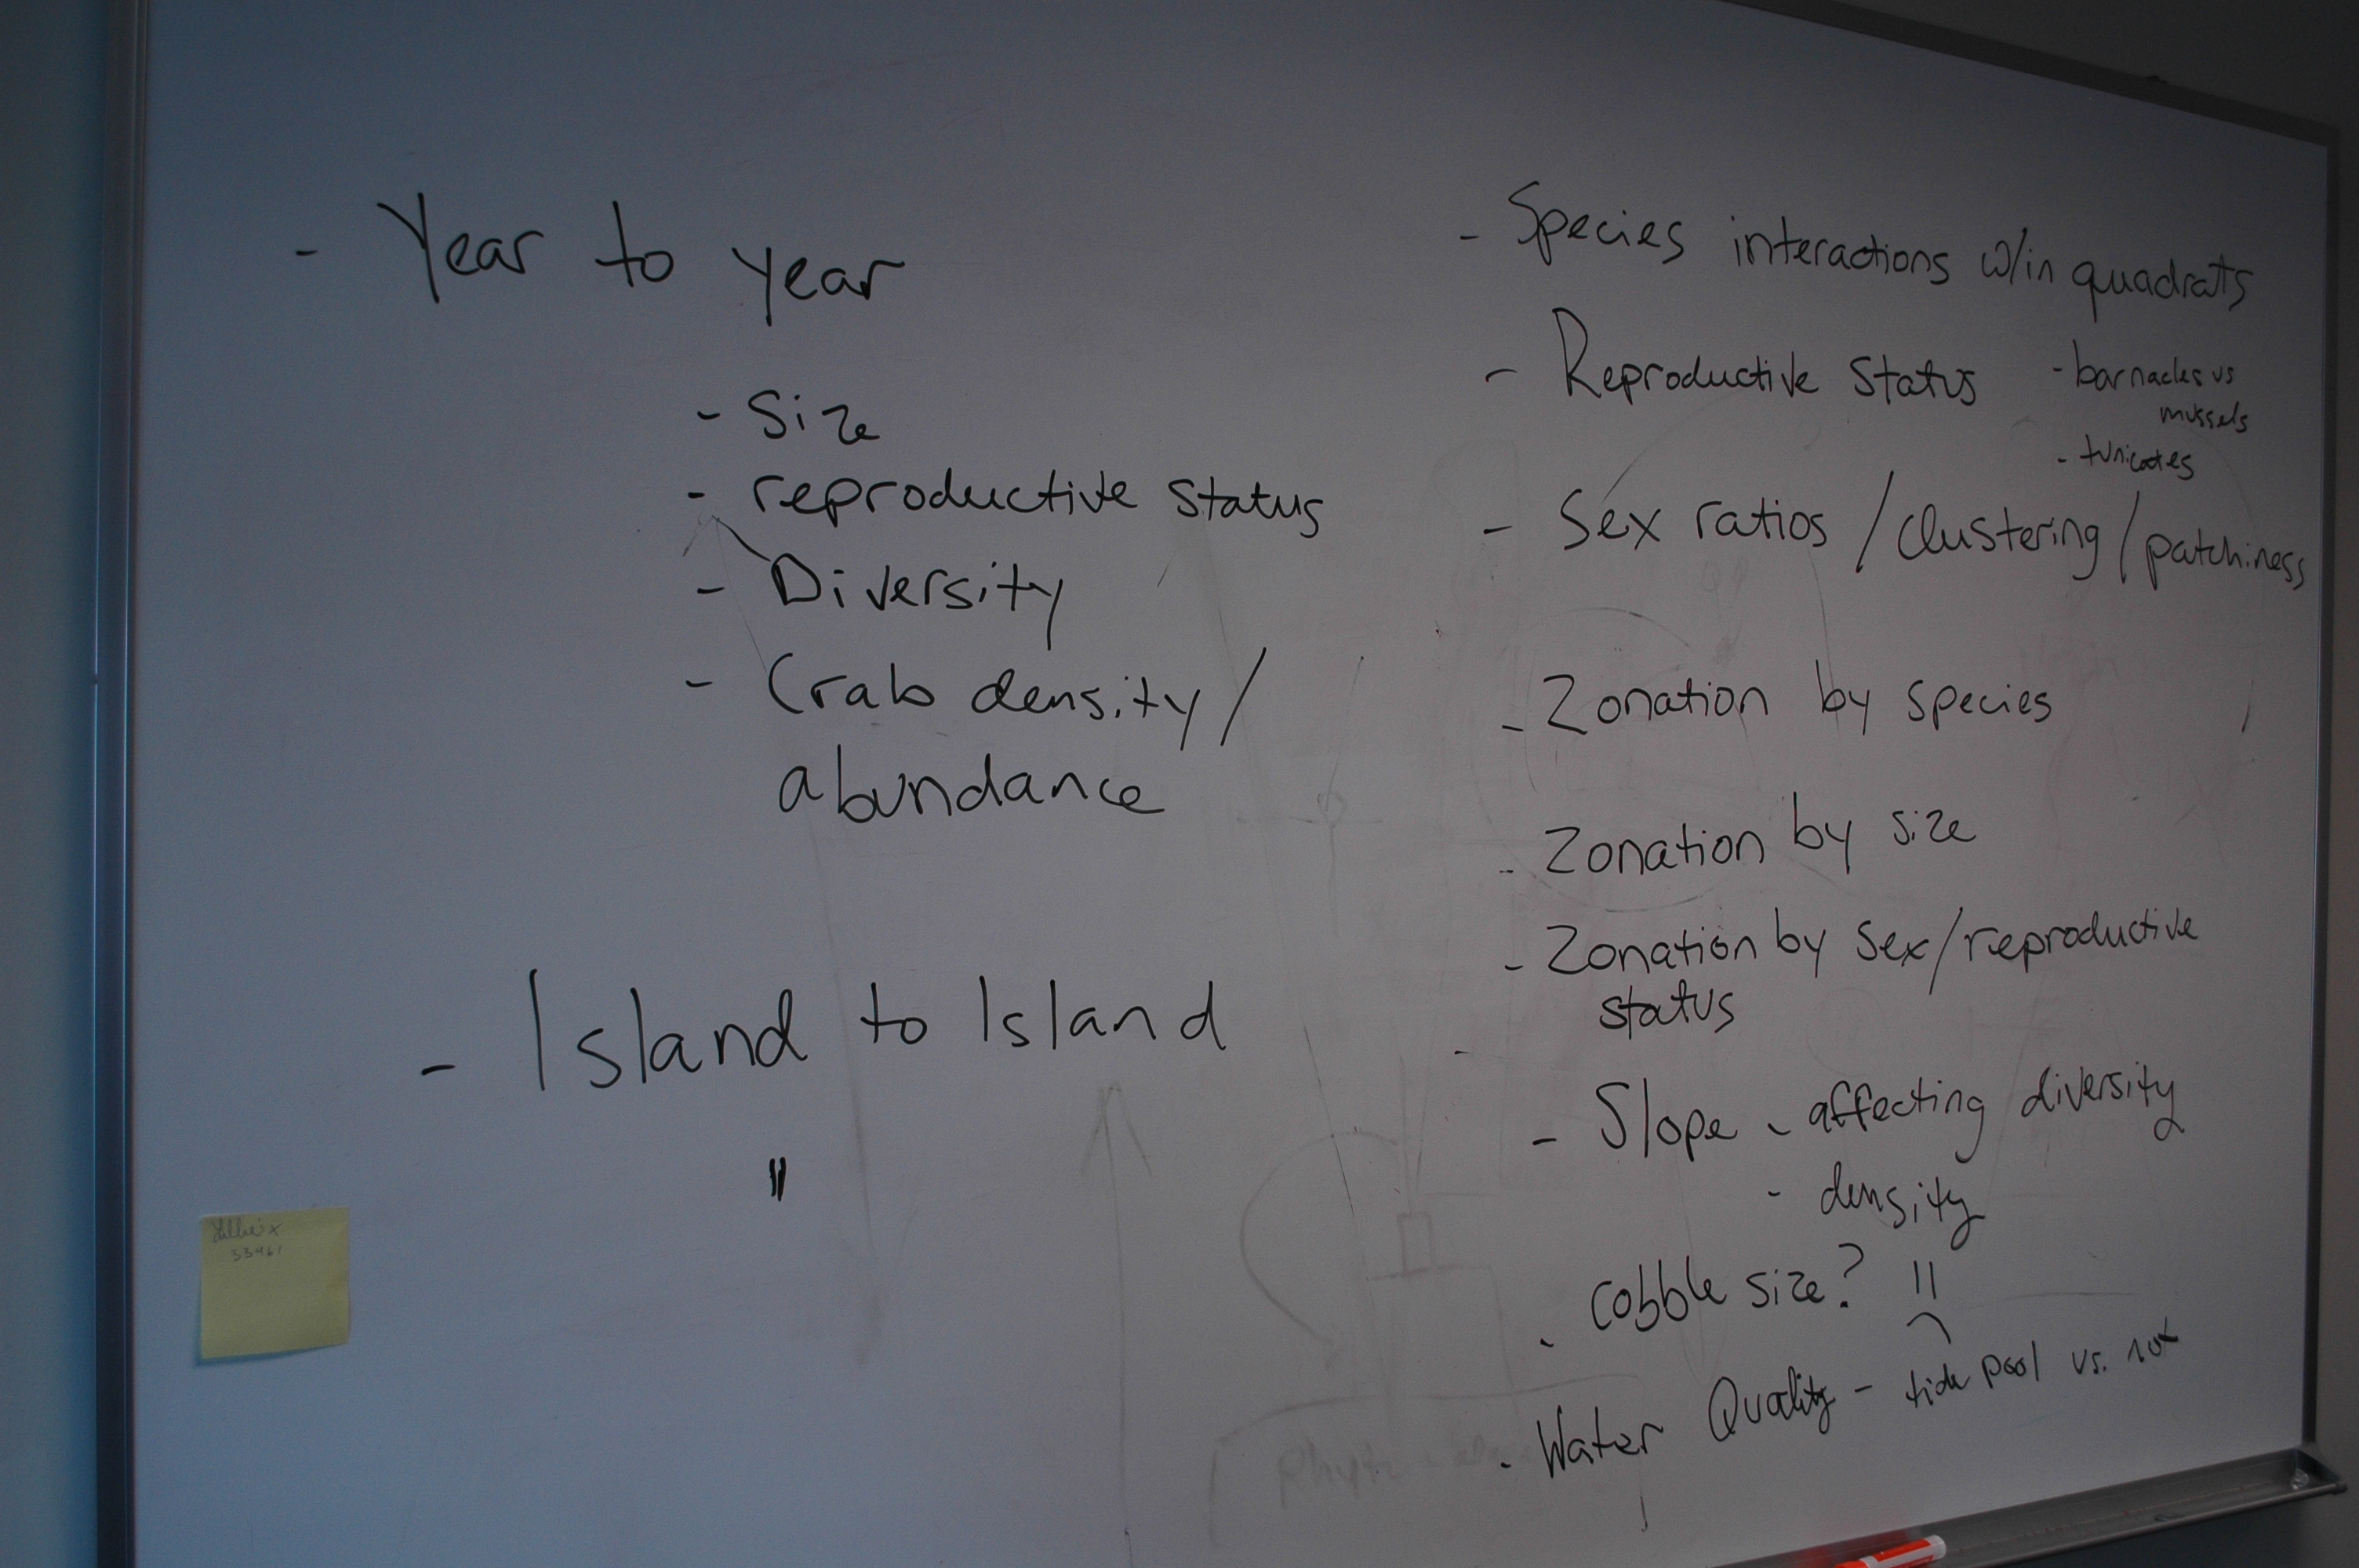
Brainstorming research question ideas.

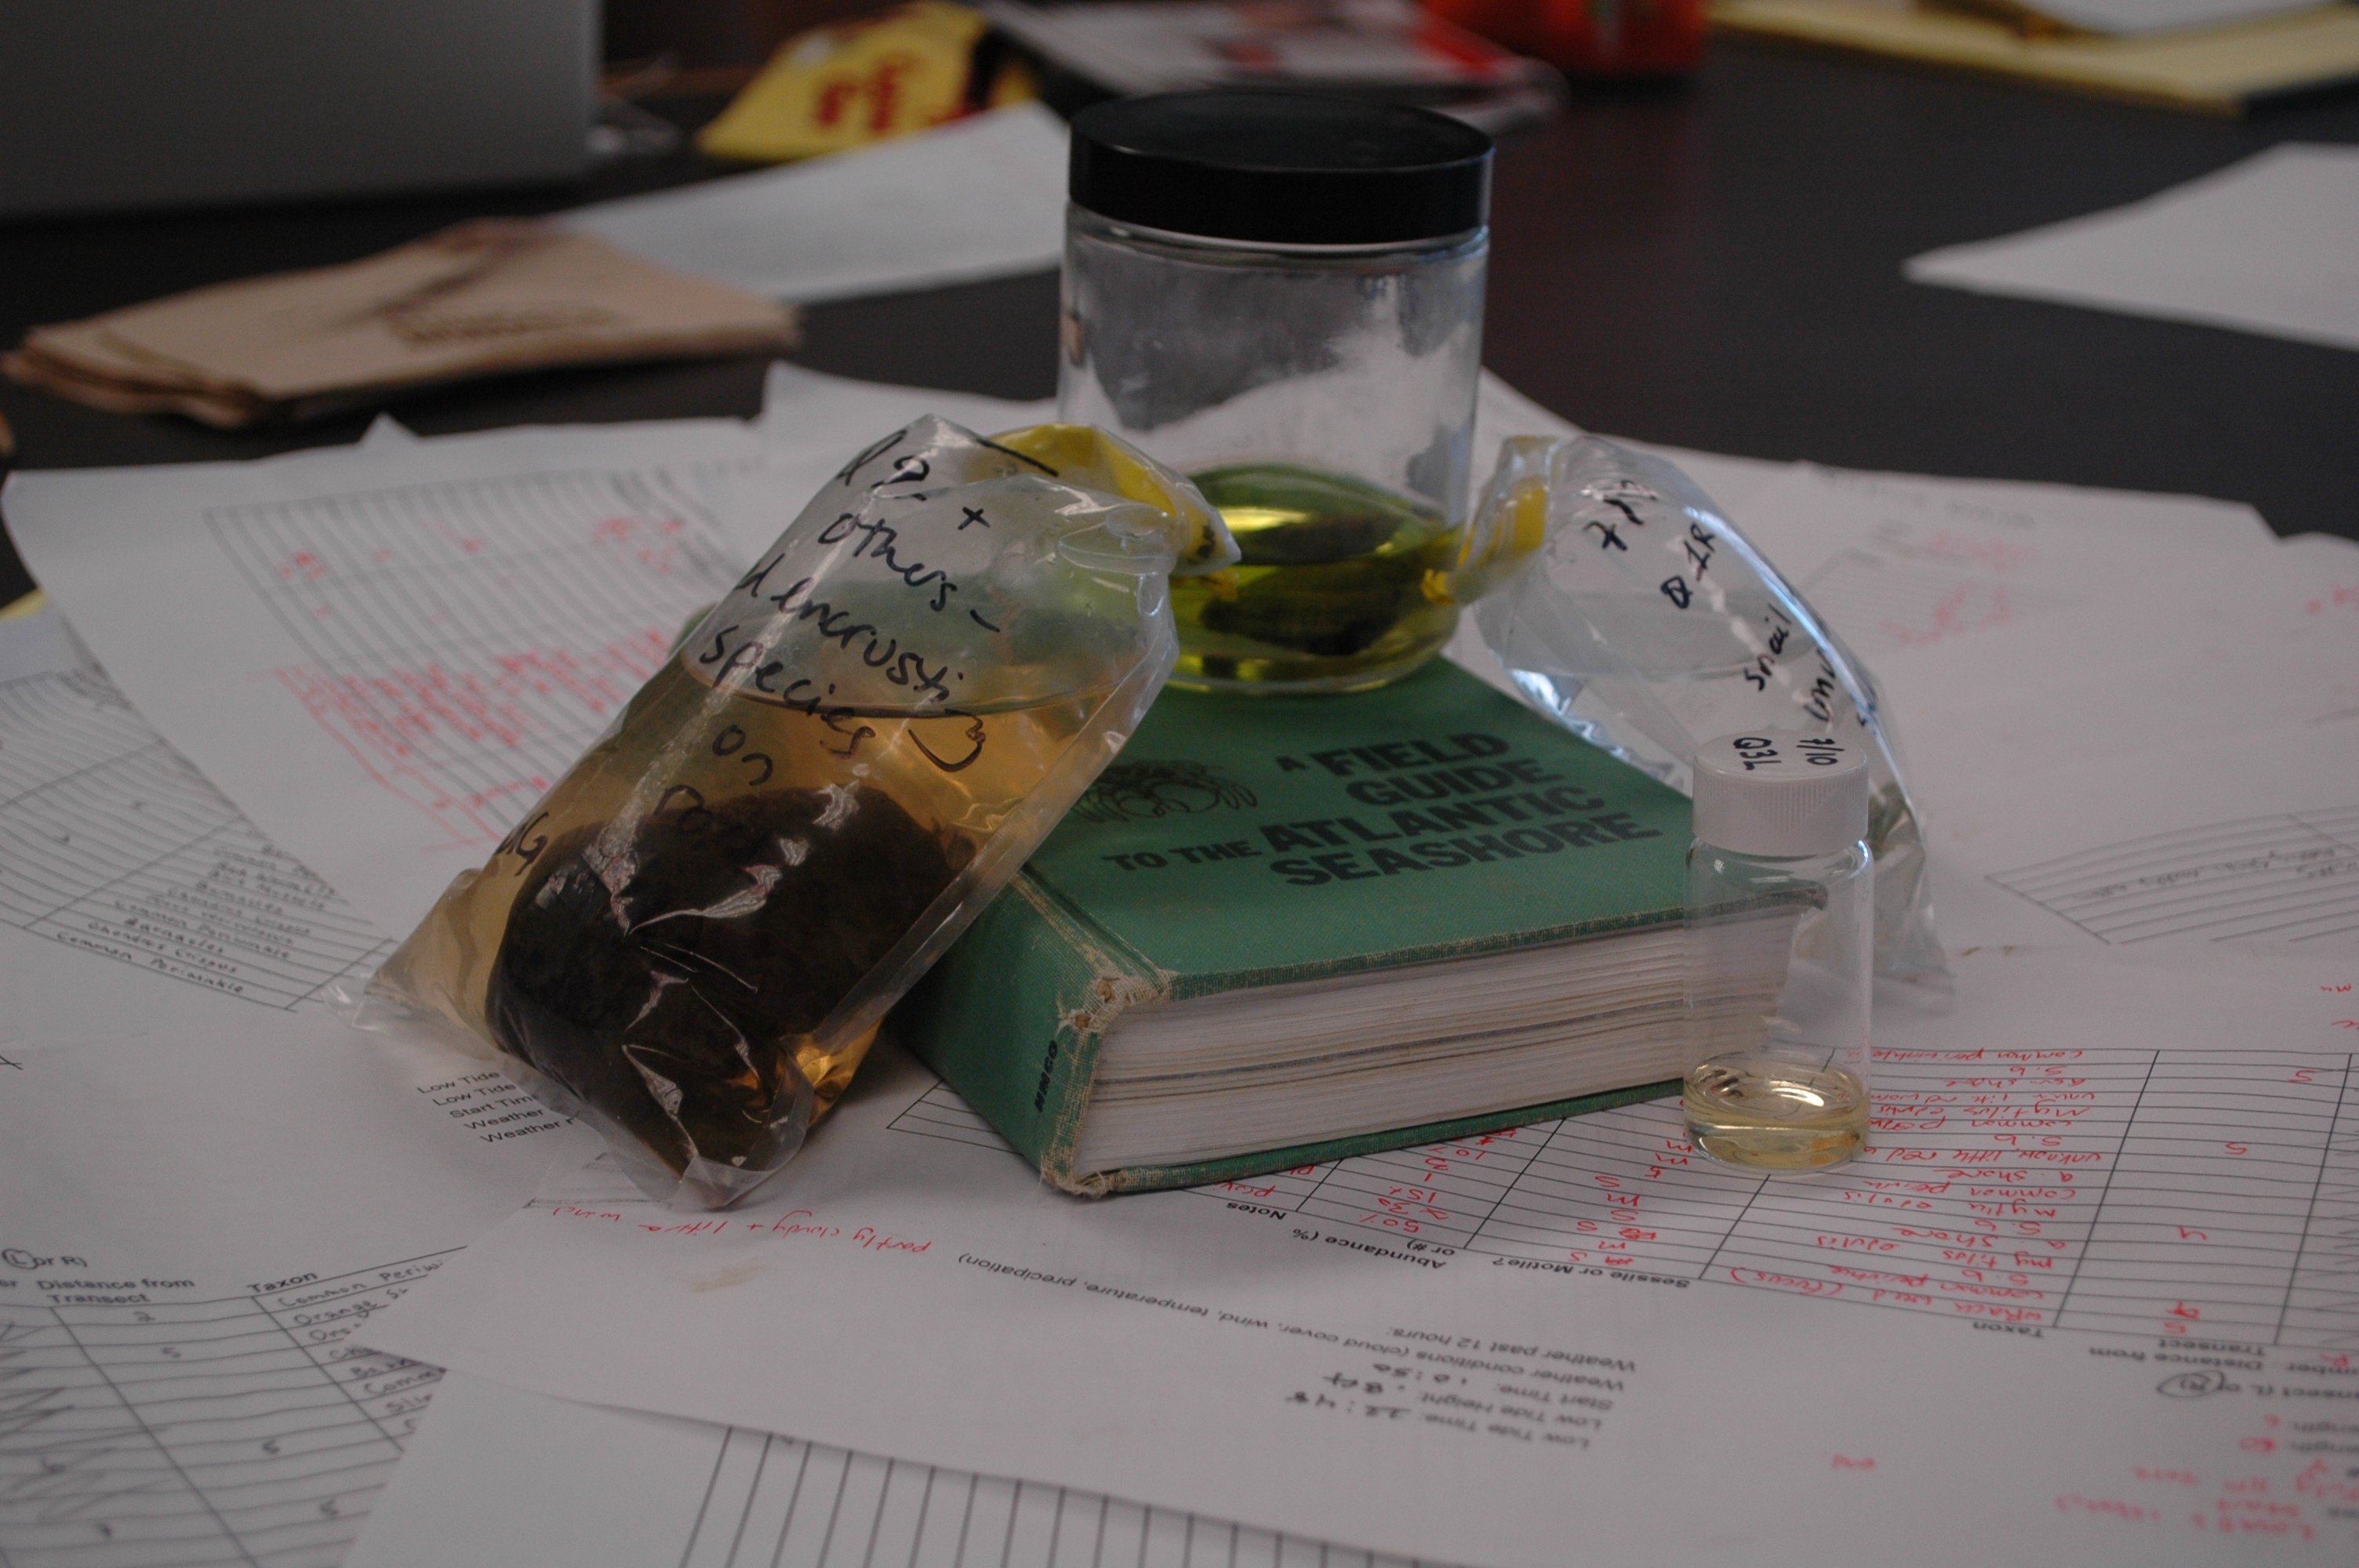
Data sheets, samples for identification, and a field guide.

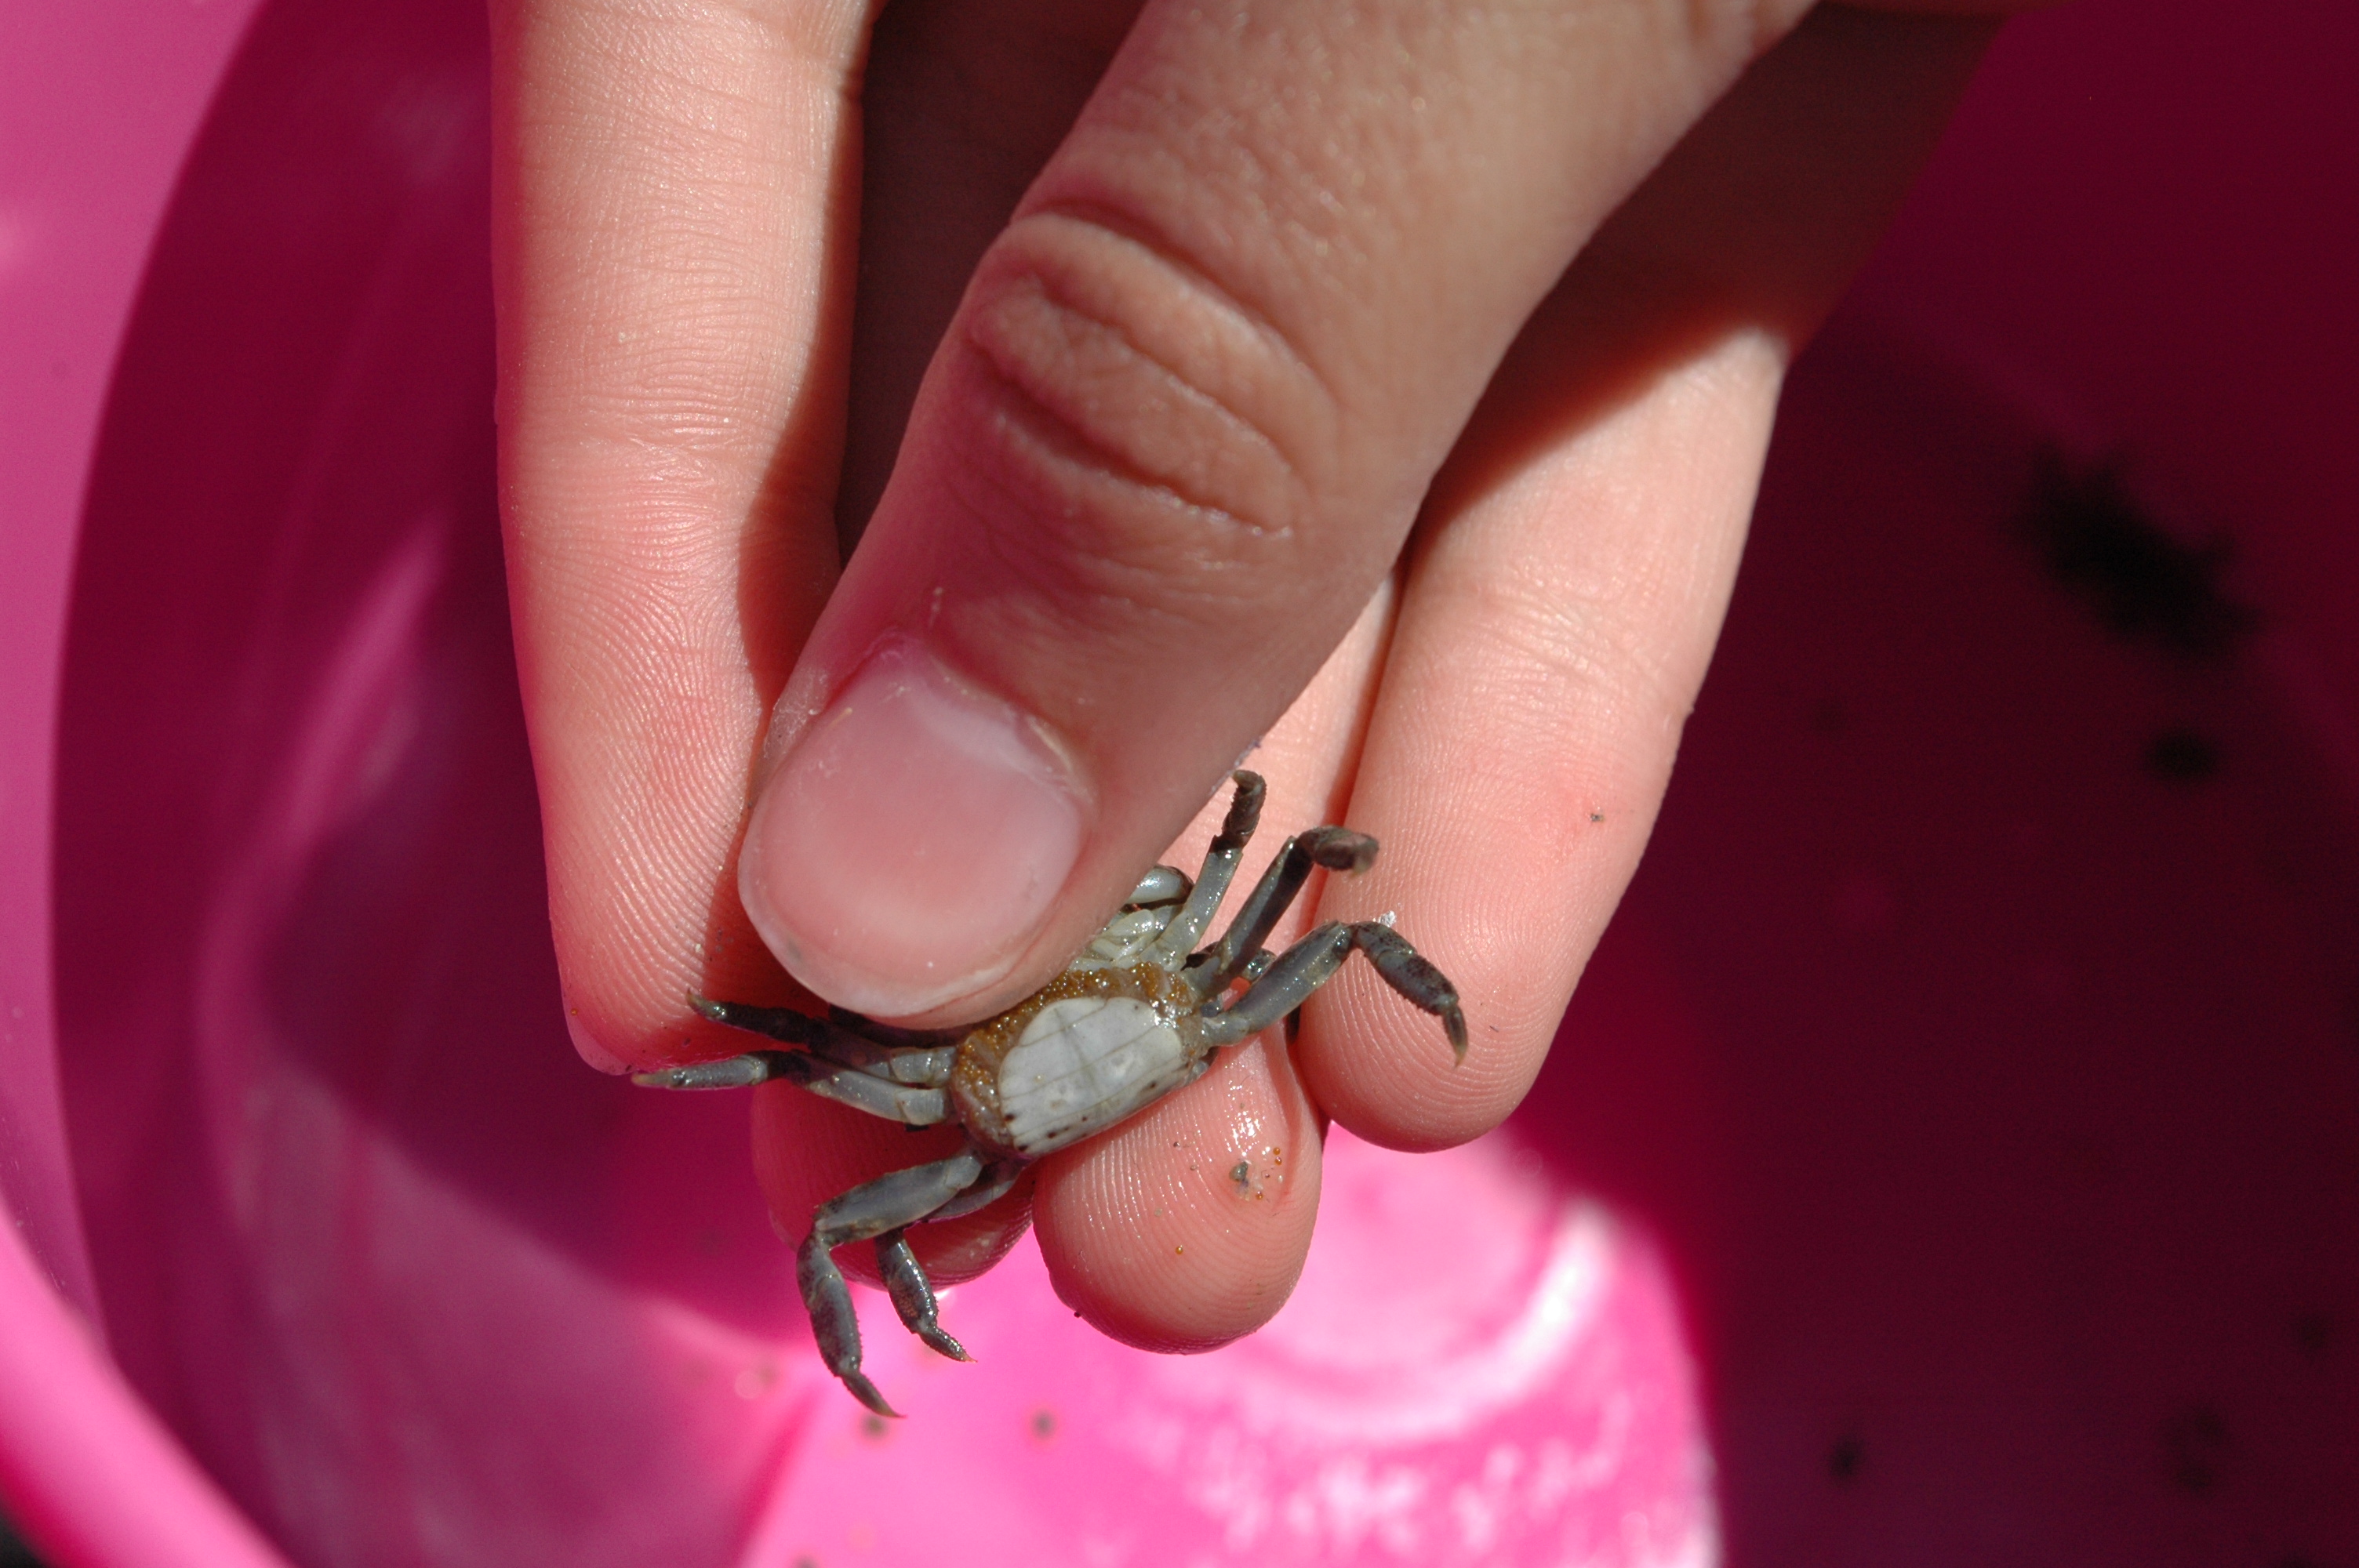
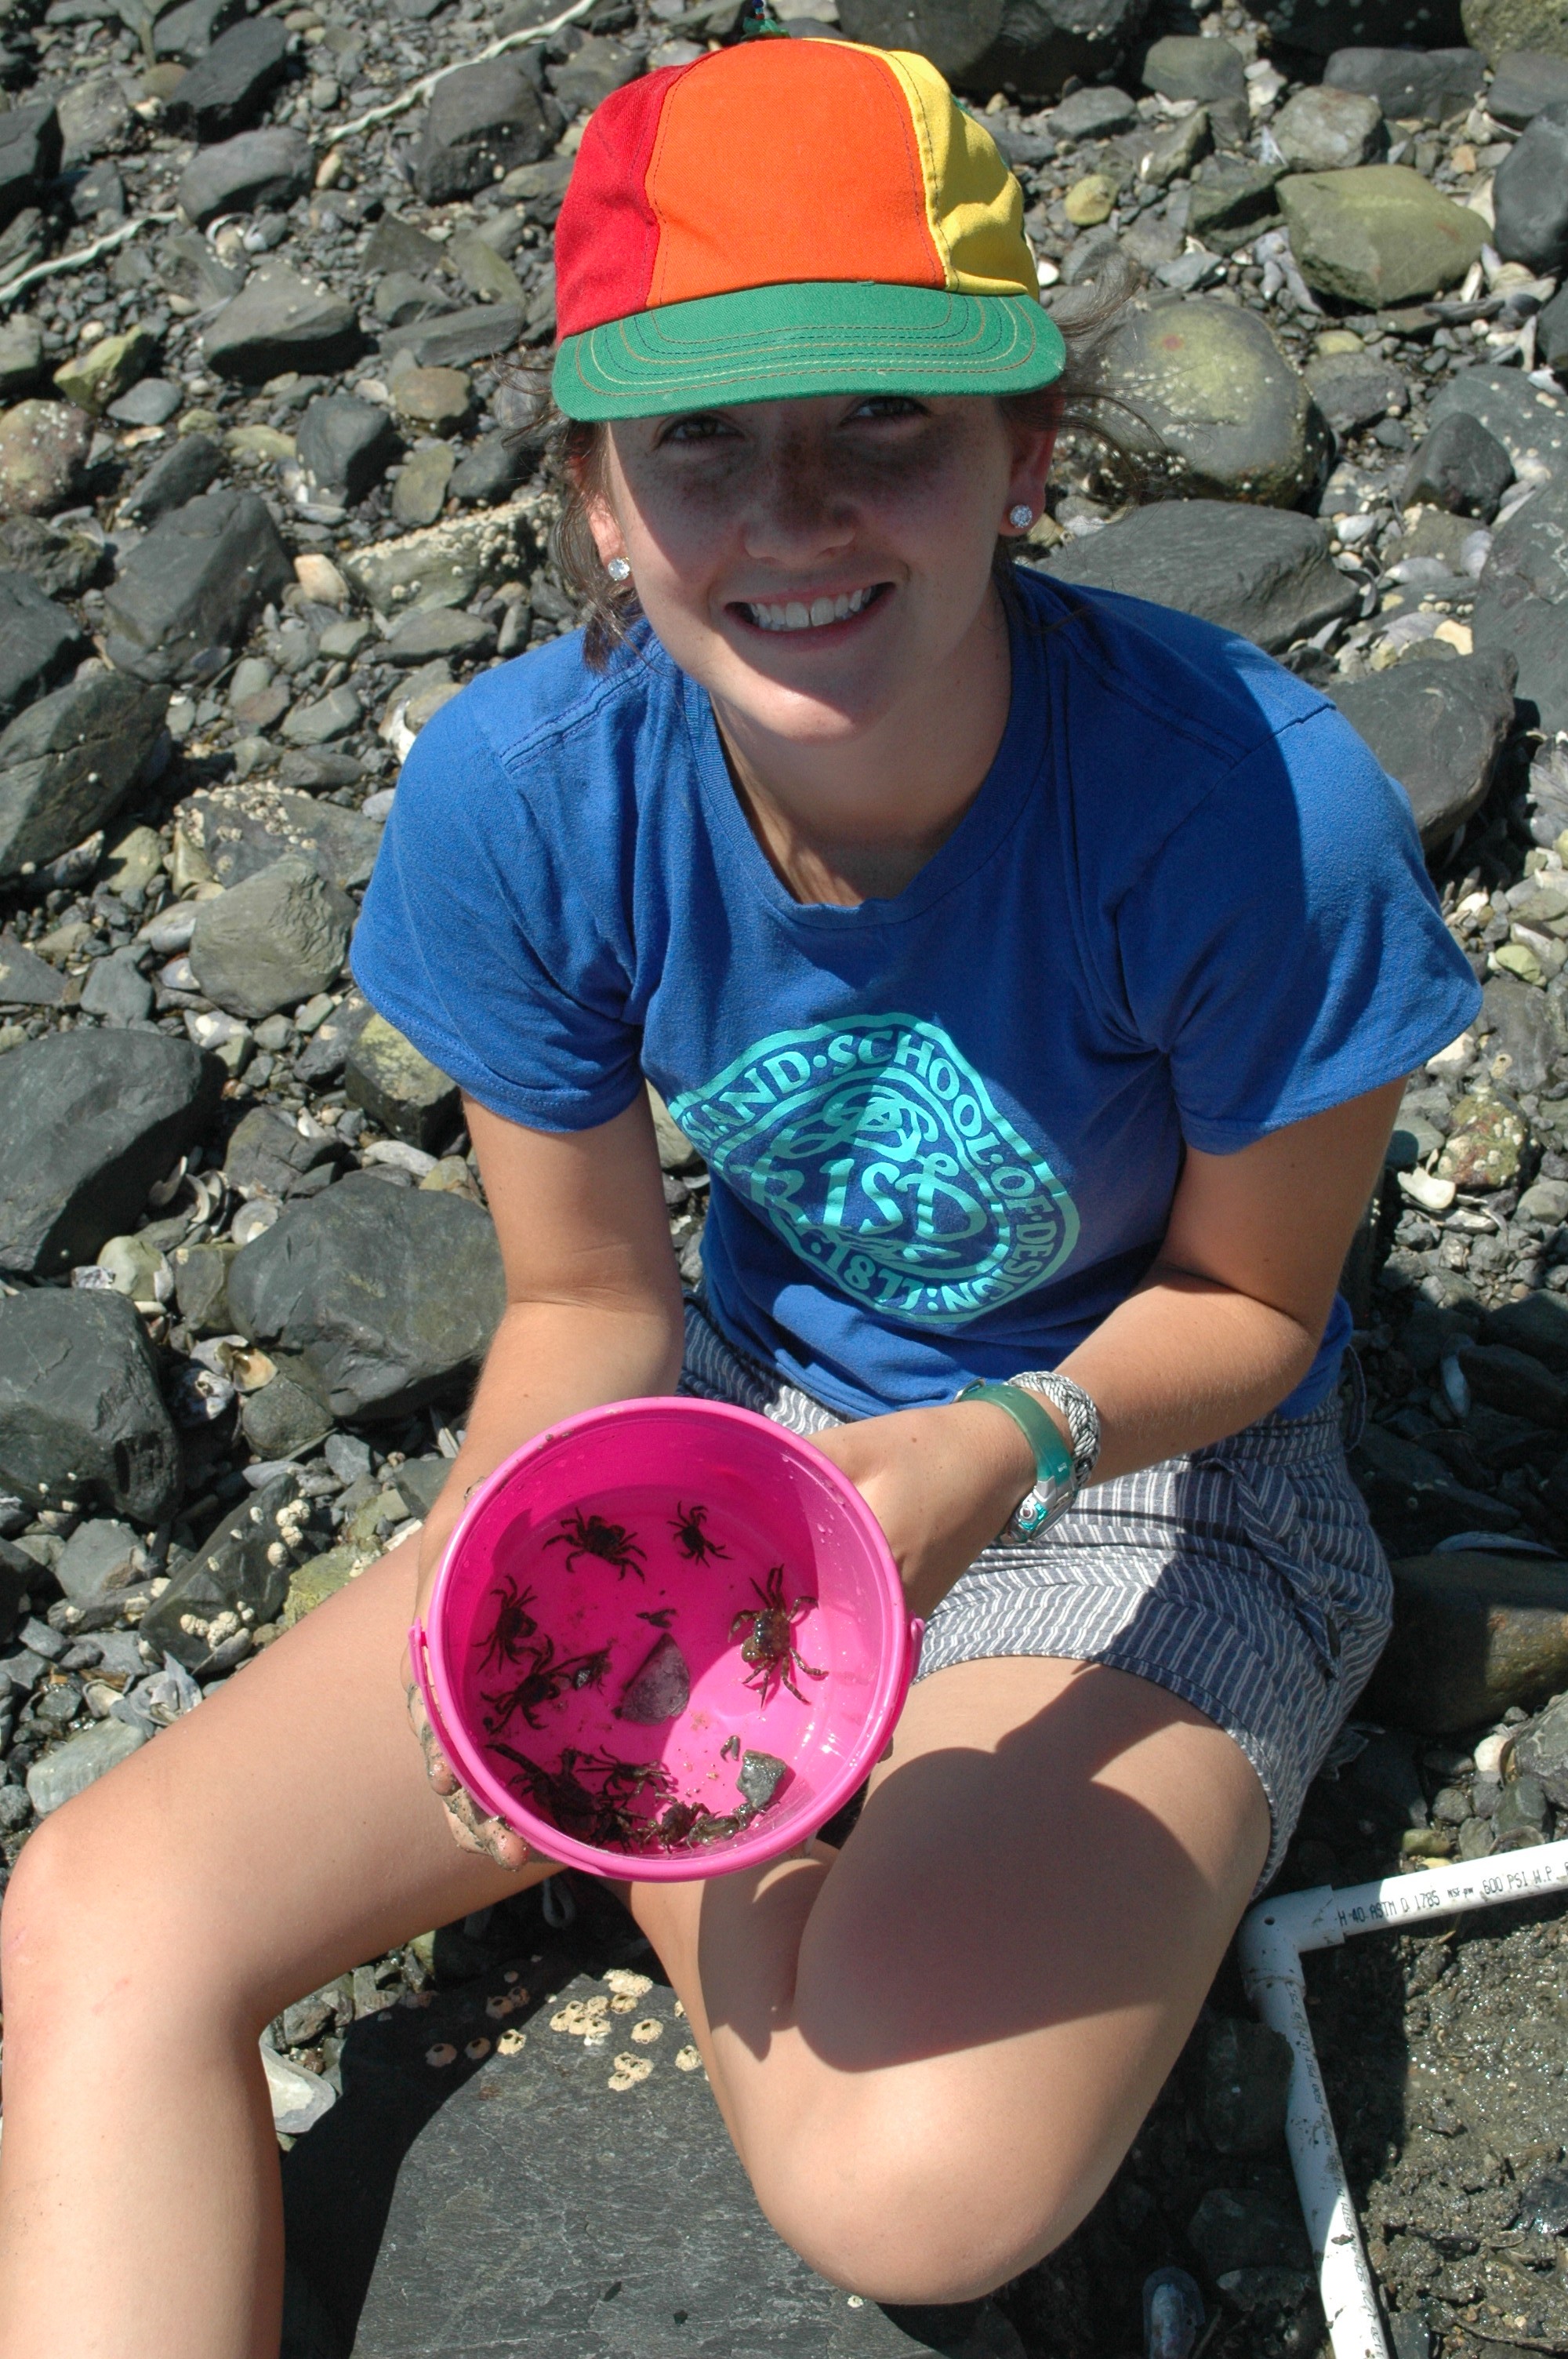
Today we took all the samples that we collected in the field down to the lab where we used the microscope for identification purposes. We were able to identify all our samples except one mystery tunicate. We made a very exciting find today. It turns out that the shrimp we found on Lovells Island is Palaemon elegans, otherwise know as the European Rock Shrimp. Ours was the first specimen to have ever been documented in Boston Harbor. P. elegans was first found in Salem Massachusetts in 2010, which makes it a relative new comer to the area.

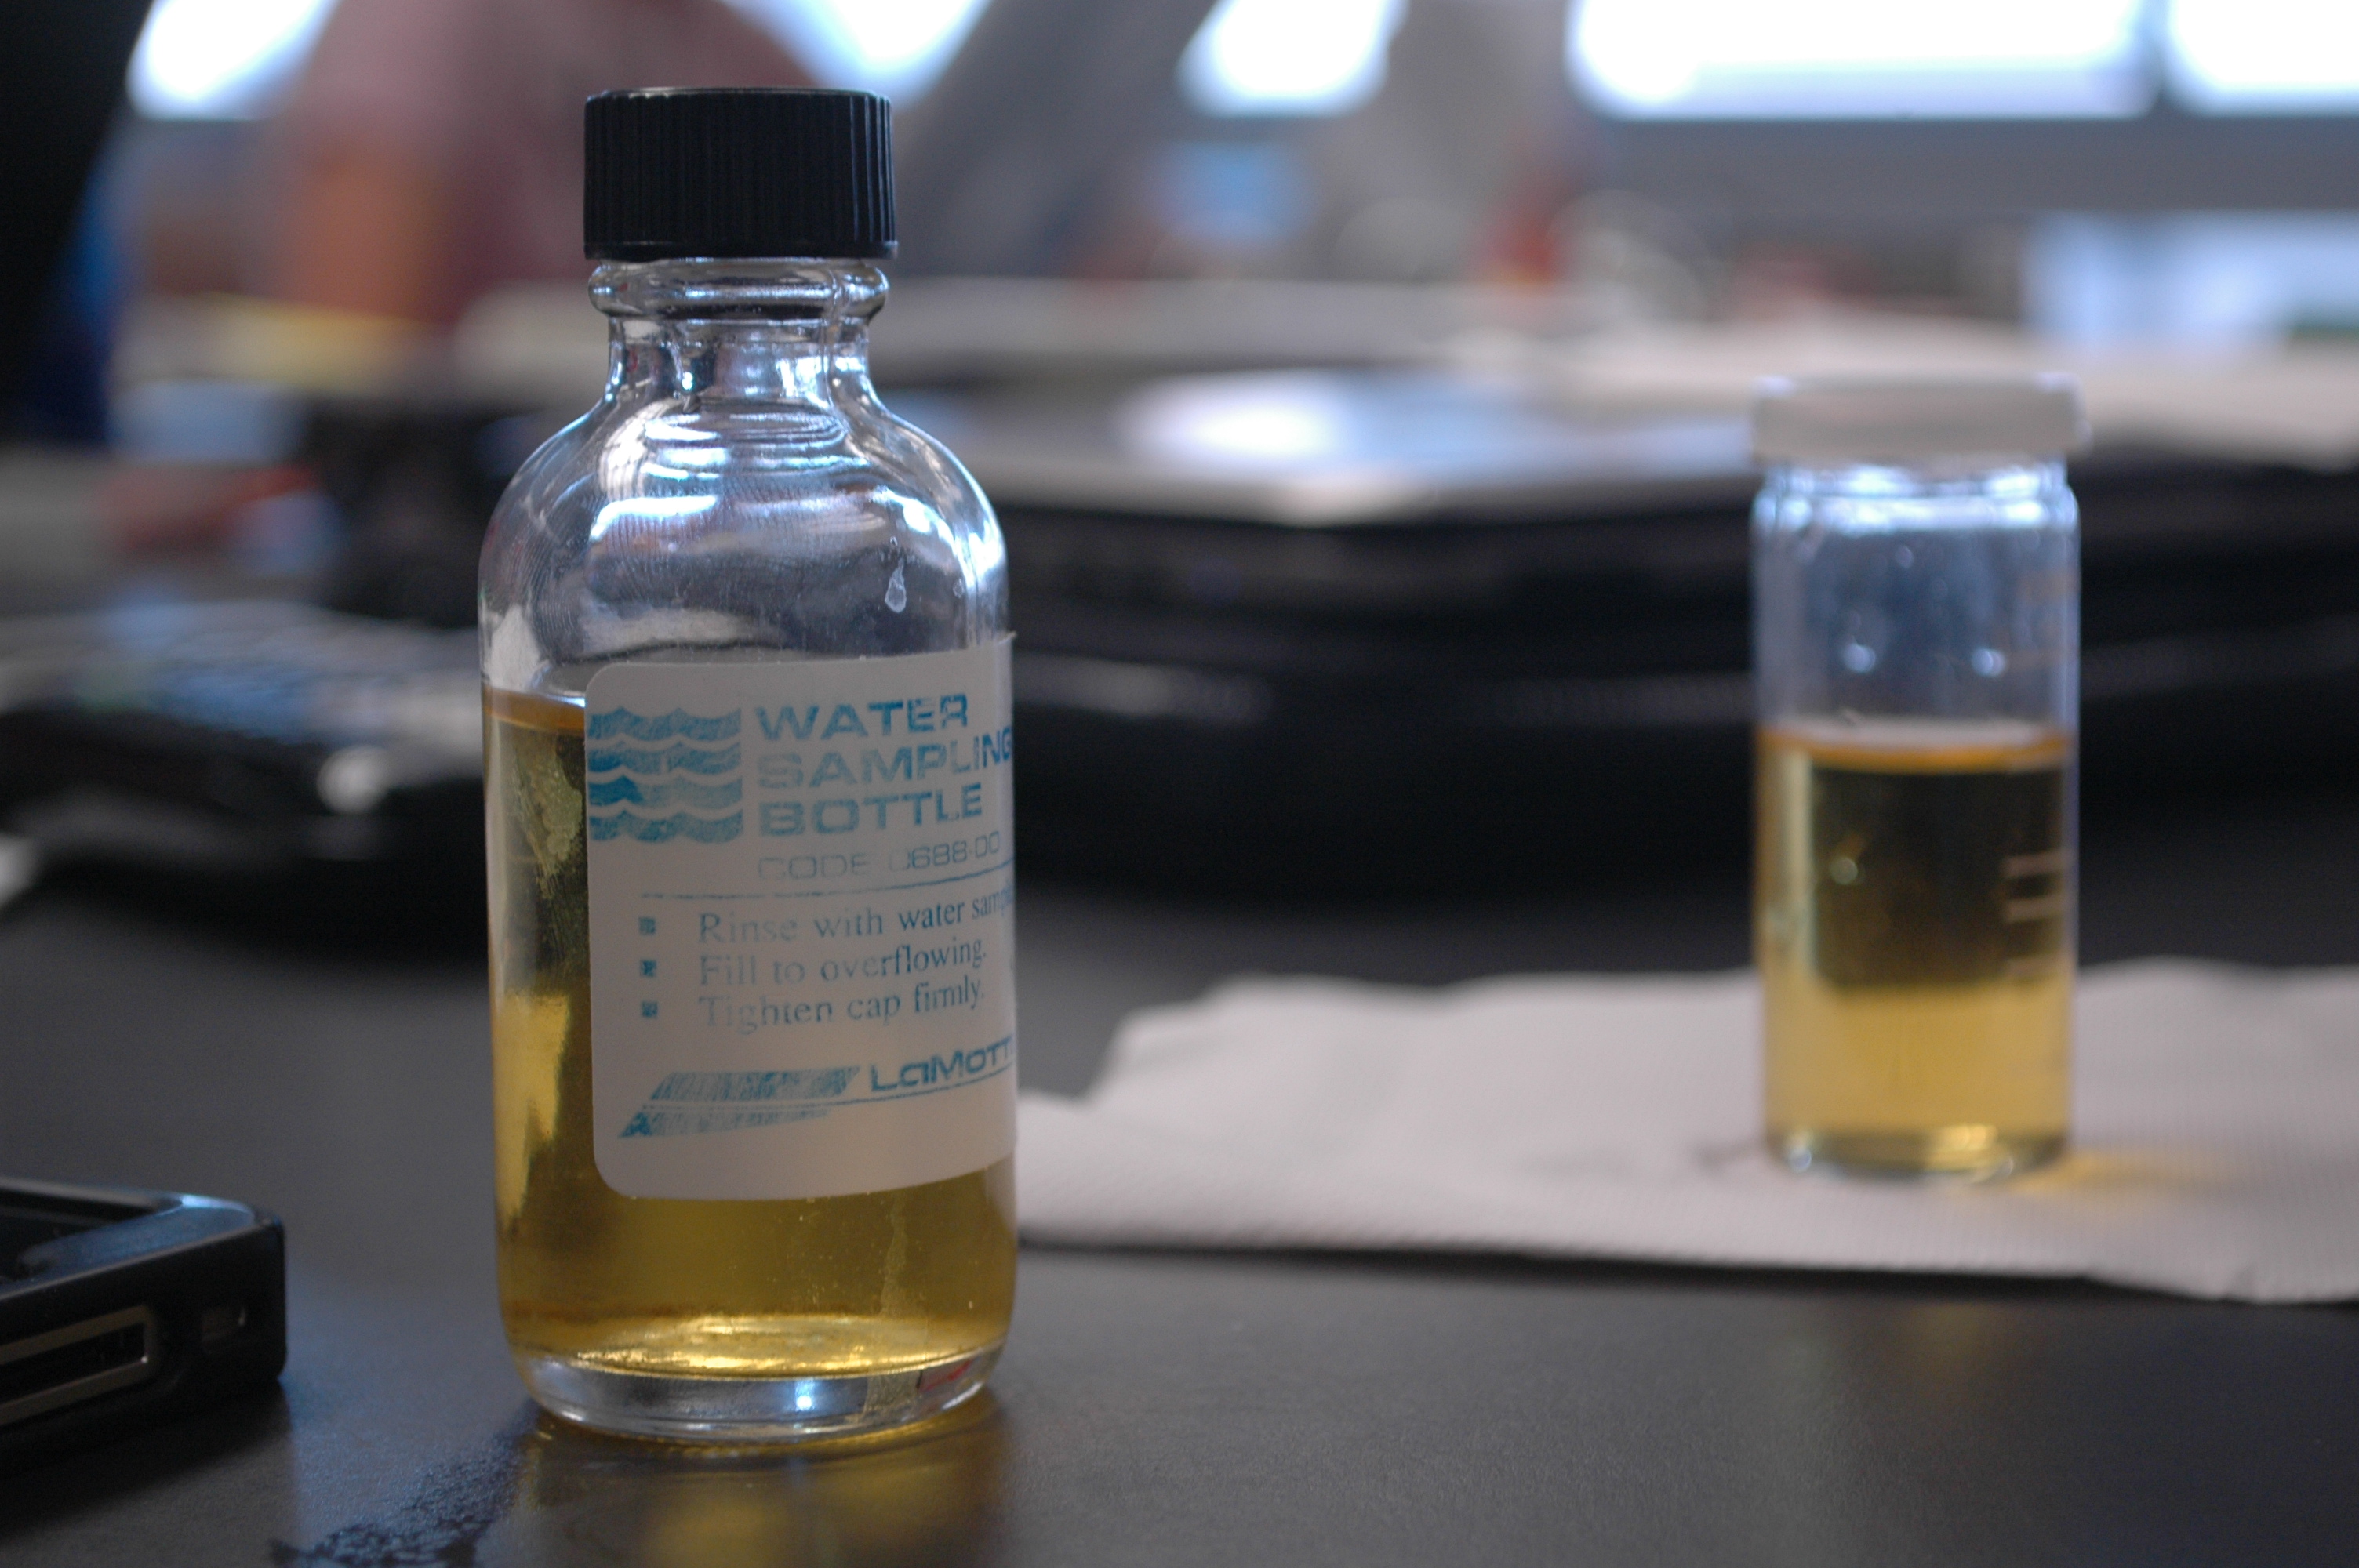
Winkling to Determine Biological Oxygen Demand (B.O.D)

Determining invasives/ non native species found in this year’s survey versus last year’s.

Wrangling Crabs

Conducting a quadrat sample.

Today was when the real science began: Data collection. We met bright and early at the Sea Grant offices to make the trek, with all our gear, down to the docks in order to catch the ferry. Today we were lucky enough to be joined by Lily our resident filmmaker who took video footage of us as we worked and kept us entertained with stories of her adventures throughout the world.

Our field site. 

We squeezed onto the train with quadrats, transect tape, and meter sticks in hand to begin our day of science. We took the 9:30 ferry to Spectacle Island, and after a hike through grass and over rocks we made it to our field site by 10:15. The first thing we did was lay down our transect line, starting at a point predetermined by GPS. The transect that we did today measured 40 meters in length.Starting at the low tide line, we took a quadrat sample every 4 meters, on both the left and right sides of the transect tape, recording the abundance and variety of species that we found. Each quadrat, a quarter of a meter squared in size, was laid down perpendicular to the transect line a random number of meters away from the line. The distance of the quadrat from the line was determined using a random number generator so that we could get the most accurate data possible and avoid bias into our sampling technique. Once one of us had placed a quadrat it would be a madcap race to wrangle as many crabs as possible and put them in a bucket for later inspection. Before today I had no idea that there were so many of them or how small they could be. We found some smaller than 2mm. These guys were tiny!

A female Asian Shore Crab carrying eggs.

After the crab rodeo was finished we estimated percent cover of all sessile species and counted the abundance of all motile species, in each quadrat, and recorded the information on our data sheets. The most common sessile species, which we found today, were barnacles, blue mussels and several species of algae. Of the motile species the most abundant by far was the periwinkle, followed by the Asian Shore Crab, The Green Crab, assorted whelks, a couple of soft shell clams, and some red worms that have yet to identified. Next we moved on to the crabs. For each crab we found, we would identify the species, then the sex and then determine if they were carrying eggs before we released them. We took samples with us back to the lab of any species that we were still unsure of.

Wrangling crabs in a bucket.

Once we had finished our quadrat sampling we conducted a beach profile, which measures the slope and composition of the beach, and did some water quality work, which tested for dissolved oxygen, salinity, turbidity, conductivity and temperature in the water. Before we headed back to the beach to catch the 2 o’clock ferry, we spent some time exploring the tide pools near our transect site, taking pictures and collecting more data. We made it back in time to catch the ferry and ate our lunches on the boat. Once we got back to the office we sorted our data sheets, organized our samples and called it a day. Stay tuned for our adventures on Lovells Island tomorrow!

Water quality testing in a tide pool.

- Isabelle